
100 B2B startups, 100+ stats, and 14 graphs on web, social, and content
The State of B2B Marketing Report, Part 2 of 3. Built with Claude Code.

👋 This is a monthly free edition of MKT1 Newsletter—a deep dive into a B2B startup marketing topic, brought to you by Framer, Closing Media, and UserEvidence.
Upgrade to a paid subscription for: Full access to our new MKT1 MCP Server | 100+ templates & resources | Post to MKT1 Job Board | MKT1 Newsletter Archive | $40K+ in discounts in the MKT1 Perk Stack
Marketing is in a state of swirl. Old playbooks are dead or dying, new ones are still taking shape, AI is changing everything, and most teams are stuck on the same question: What do I do now?
Some teams are stuck in the old world. Other teams are moving forward: an account-driven foundation, individual social accounts as the new company page, ecosystem and events as growth engines, less reliance on search and inbound. All the things I’ve been writing about for the past year...
But I wanted a better sense of what’s actually going on. Once I started researching 100 fast-growing B2B startups in Claude Code, it was clear I had to move beyond team and leadership data (covered in Part 1 of this report) and into the actual marketing activities. Anything I could glean from scraping websites, social profiles, ad libraries, careers pages, and pricing pages.
Here are the results, covering marketing activities across web, social, and content data points. Scan these graphs, read the analysis in the bullet points, or even access the data in Claude Code via our MCP Server.
Maybe you’re focused on your website and trying to convince your sales leader to actually show pricing publicly, picking a CMS for a relaunch, or making the case for a website redesign. Maybe you’re trying to figure out where to invest content efforts and deciding if your blog should keep going or quietly retire, if your site is AEO-ready, or if your founder’s LinkedIn is worth investing in. Or maybe you just want to see how you stack up against peers your size, get a single stat to back up your strategy, or understand trends in what marketers are doing right now. It’s all in here (or in part 1!).
Want to go further? The MKT1 MCP Server lets you query the full dataset directly in Claude Code. You can also run the same analysis on a list of companies you care about.
Recommended products & agencies
We only include sponsors we’d recommend personally to our community. If you are interested in sponsoring our newsletter, email us at sponsorships@mkt1.co.

Framer: DoorDash, Perplexity, Mixpanel, and Mutiny’s websites are all built on Framer. From early-stage startups to Fortune 500s, Framer is the website builder I personally recommend. It works like your team’s favorite design tool, with AI-powered building, integrated A/B testing, and one-click publishing.
🔓 Offer: Get 15% off a Yearly Pro plan with code MKT15. Annual MKT1 Subscribers get 30% off a Yearly Pro plan in our Perk Stack.
—
Closing Media is a boutique agency that runs LinkedIn and Google campaigns for growth-stage startups. They know the best ways to build and scale ad campaigns in 2026 (hint: thought leader ads and video!) and have years of expertise (I worked with them in 2018!).
🔓 Offer: Reach out to Closing Media here & mention MKT1 to get $5,000 of free ad spend for your next campaign.
—
UserEvidence handles the entire customer proof process. From collecting stories and quotes, to matching references to prospects, to activating advocates. Gong, HackerOne, and Superhuman use it to build trust…because logos on a homepage aren’t enough.
🔓 Offer: Mention MKT1 for your first 2 months of UserEvidence free
In this newsletter:
🔙 Part 1 - Previous newsletter: State of B2B Marketing Teams
➡️ Part 2 - This newsletter: State of B2B Marketing Activities
State of Websites: What they're built on, what's in the hero, and pricing page trends
State of Social: Founders vs. companies on LinkedIn and Twitter, LinkedIn ads
State of Fuel: Blogs, events, communities, newsletters, and AEO readiness
⏰ Part 3: Claude Code researching and reporting, plus takeaways based on creating these newsletters
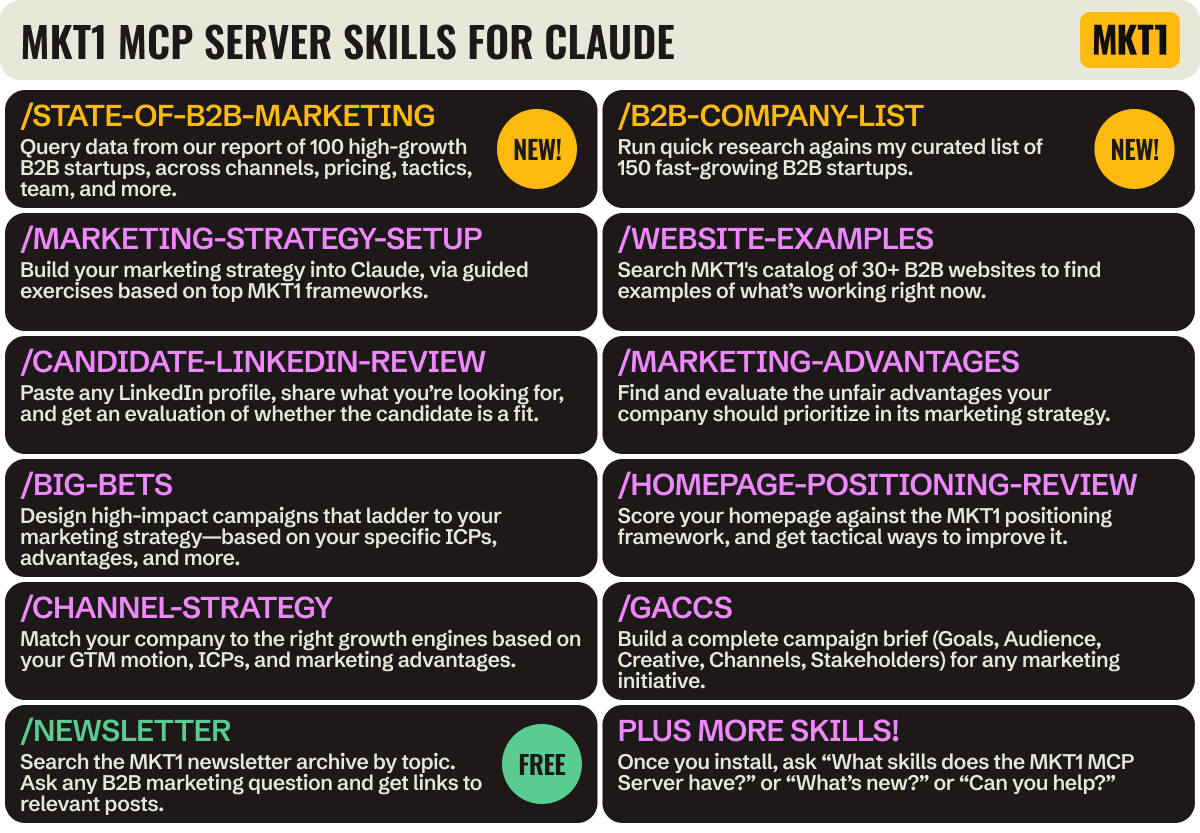
Bonus for paid subscribers: 2 new skills related to this research & report in the MKT1 MCP Server:
/100_company_marketing_research
Query the full dataset behind this report: 100 high-growth B2B startups, 90+ data points each, covering GTM motion, team composition, social, ads, homepages, CMS, conversion, and AEO readiness.
/high-growth-b2b-company-list
My curated list of 150 high-growth B2B companies ready as a reference set. Run quick research across a solid list of companies instead of starting from scratch every time.
The State of B2B Marketing, Part 2: Marketing Activities
*Based on what Claude Code can research with Emily Kramer’s prompting
Methodology
A few notes that matter for reading the charts:
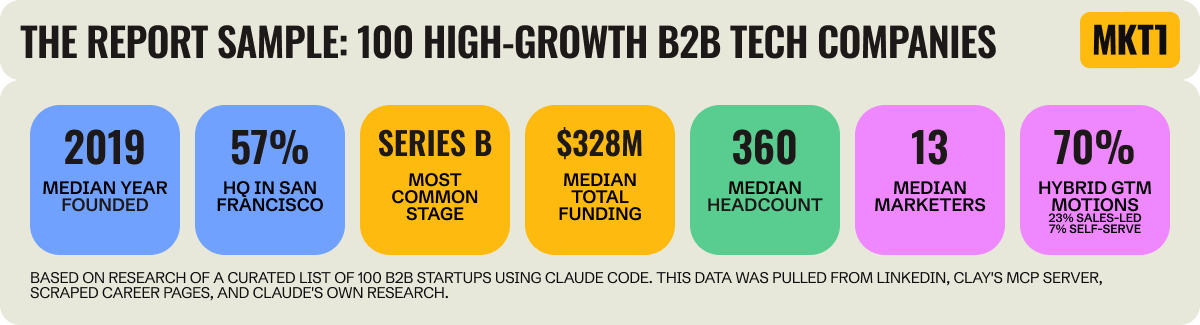
The sample of 100 B2B startups is curated, not random. The intention is to show what the “top” B2B companies are doing right now.
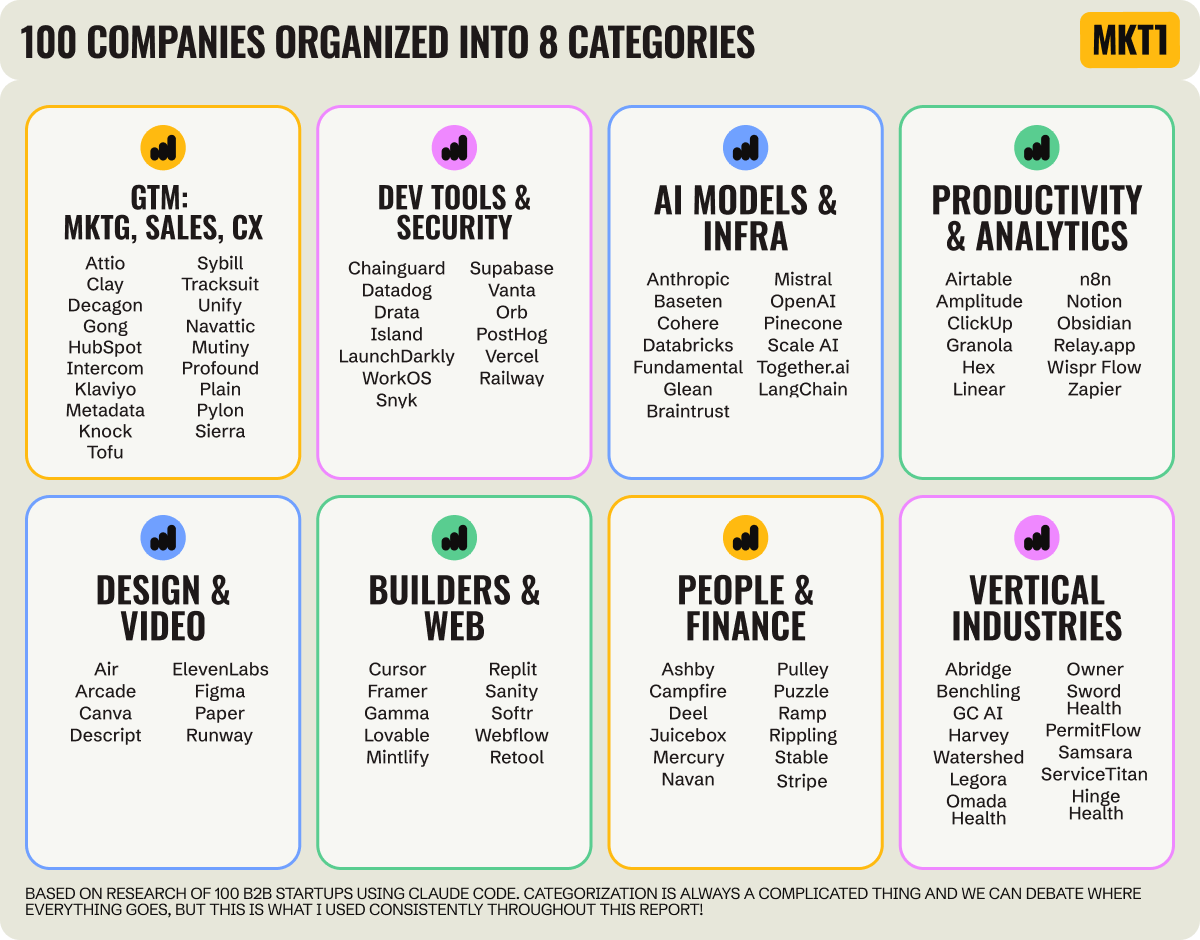
I divided the companies into 8 categories by audience and function. This is subjectivity—you might have grouped them differently.
There may be mistakes in the data. No one’s perfect, not even me or Claude.
For the complete methodology, see Part 1 of this newsletter series ➜
The state of B2B websites
Let’s start with the website. It’s very easy to research web trends in Claude Code, because you can scrape without asking! I pulled the homepage, hero, pricing page, and CMS for all 100 companies, and cut the data by GTM motion, category, and company size.
Want more on web? I recently wrote all about what modern websites include today, with tons of examples in this newsletter. This report gives a more quantitative view of what’s going on.
🎯 MY FAVORITE STAT(S):
Companies with a sales-led GTM motion hide both their product and their pricing. 22% have product screenshots in the hero, and 0% show prices on a pricing page.
0 companies in our study have fully vibe-coded websites. Most use an all-in-one site builder or headless CMS.
What are websites built on? Has vibe coding taken over?
Note: A CMS is the thing that lets a marketer change a headline or swap a logo without bugging an engineer. Framer and Webflow are all-in-one CMSs (design tool + content tool in one). Sanity and Contentful are headless CMSs (just the content tool, paired with a custom front-end).
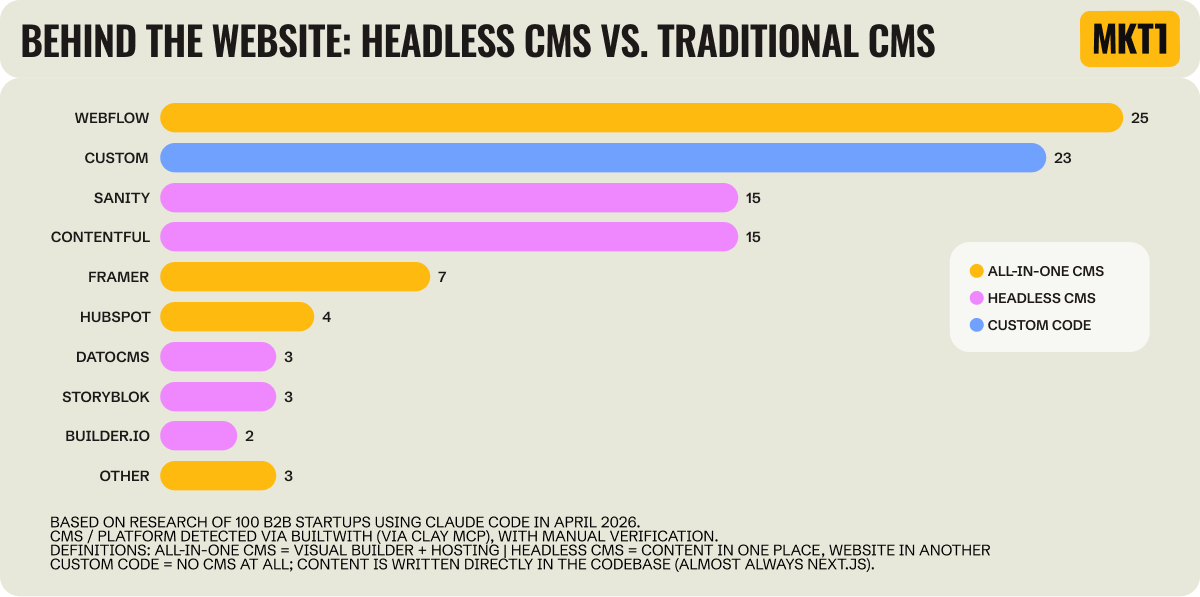
➜ 39% of B2B sites are still on all-in-one platforms
The headless CMS category is right behind at 38% (Sanity 15%, Contentful 15%, others combined).
At 25% overall, Webflow is the most popular way to build a site across all 100 companies, not just the all-in-one category. (Unfortunately I can’t tell when these companies first built on Webflow.)
➜ 23% have no CMS; mostly design tools, dev tools, and AI builders
This likely means that 23% of marketing teams are annoyed by how hard it is to update their site (just a hunch!).
Companies in the GTM (5% custom), people, and finance (8% custom) categories almost never go custom. The rule: If your product isn't technical, your website probably isn't either.
“No CMS” almost always means Next.js code, likely with engineers managing the content directly.
➜ Vibe coding hasn't replaced the traditional CMS yet (emphasis on the yet)
Zero of the 100 companies built their primary site with an AI builder (not even Lovable or Bolt). Some likely have secondary sites or landing pages built this way, though.
Among companies under 50 employees, 45% have no CMS.
Those small companies are the most likely to ditch the developer next year and just ask Claude Code (or a vibe coding tool) to make the change instead.
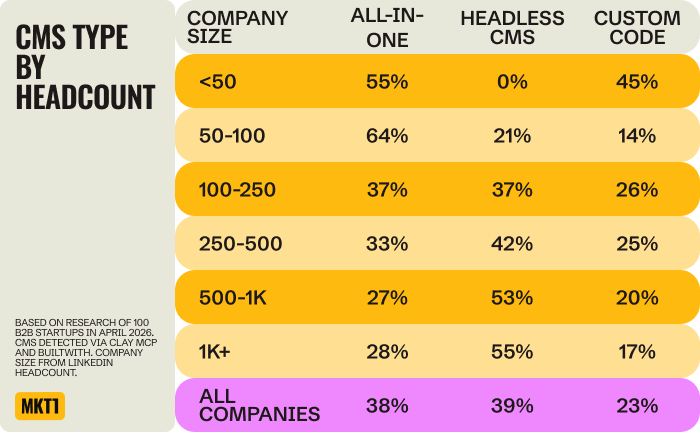
➜ The bigger the company, the more likely the website is built on headless CMS
At over 250 employees, there are more headless CMS sites than all-in-one CMS sites. At 50-100 employees, only 21% are on a headless CMS; by 1K+, it’s 55%.
Why it happens: Once a marketing team has 15+ people, a headless CMS lets the engineers build whatever front-end they want and lets marketers update content separately.
➜ When marketers are first hired, companies move to an all-in-one CMS (from a custom coded site)
All-in-one CMS peaks at 64% in the 50-100 bucket, the same bucket where the median marketing team jumps from 1 to 4 marketers (detailed in part 1 of the report).
45% of sites at companies with less than 50 people are still custom-coded. Founders probably shipped them. The first real marketing hire ends that fast.
As a refresher: Median is the middle value in an ordered dataset, and mean is the average. My team made me put this math lesson in.
What’s in the hero?
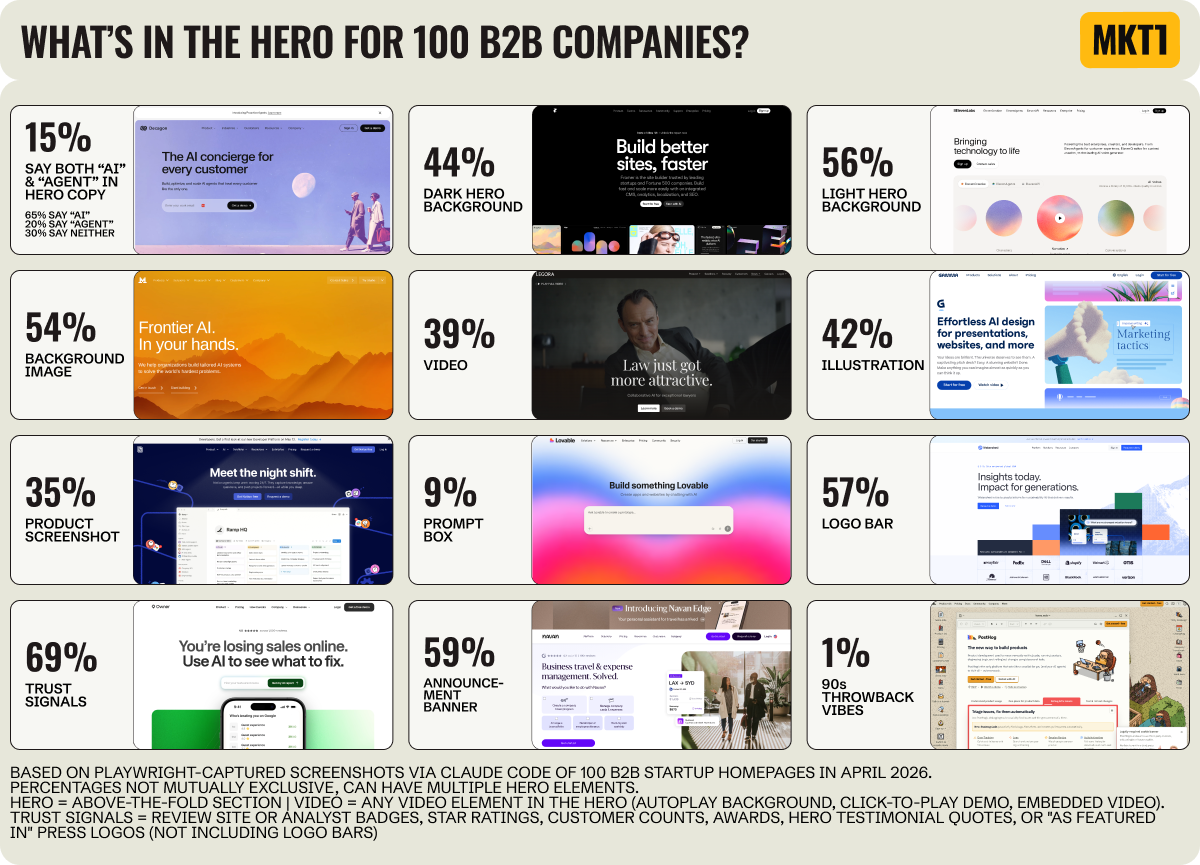
➜ Only 22% of sales-led companies have product screenshots, compared to 39% for other companies
Hybrid (37%) or self-serve (57%) GTM motions show product screenshots way more often.
Sales-led heroes replace the product screenshot with a background image (74%) or a video (57%). They also run more announcement banners (70%), likely because requesting a demo is a big ask and they need a lighter-weight CTA.
Why? Sales-led companies are afraid to show anything specific. They don’t just share product screenshots less often; they also rarely have pricing pages, and 0% show prices on the pages they do have (more on pricing pages below).
➜ The average B2B hero has a lot going on
The standard set of things above the fold: a logo bar (58% of companies), a trust signal (69%), an announcement banner (59%)
Trust signals includes review sites & analyst badges, customer counts, awards, star ratings, testimonial quotes, and press logos.
“AI” is everywhere in hero copy (65% of companies say it), but a prompt-style text input box is rarer than I thought, only 9 companies have one in the hero and all of them have a self-serve or hybrid motion.
A few standout heroes:
Legora puts Jude Law in a full-bleed video, really leaning into the “law” pun.
Owner asks restaurant owners to type their restaurant name in for a custom AI sales report, the only company not targeting tech companies with a prompt box.
And the hero maximalist: Navan stacks 8 of the 9 hero elements we tracked, plus a multiple-choice selector and the tallest announcement bar I’ve ever seen.
For more on what’s working on homepages now, check out my newsletter from last month ➜
Need help managing logos, customer stories, and trust on your website? UserEvidence, one of today’s sponsors, can help you scale customer proof.
What do homepages say?
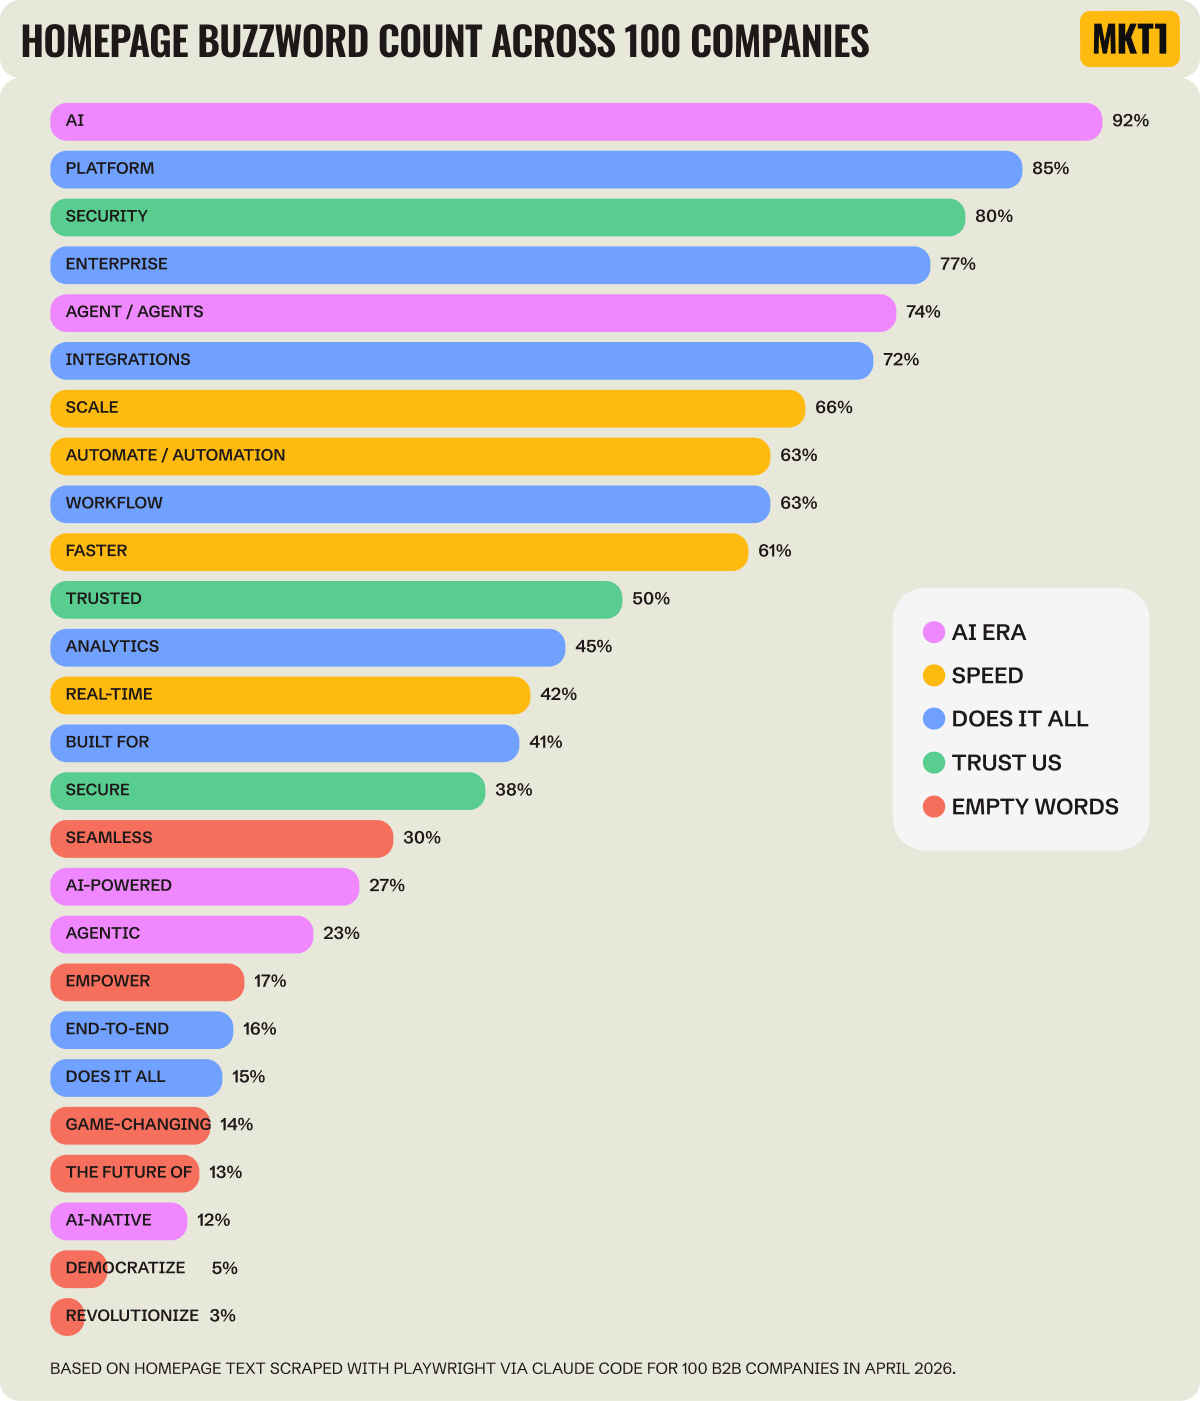
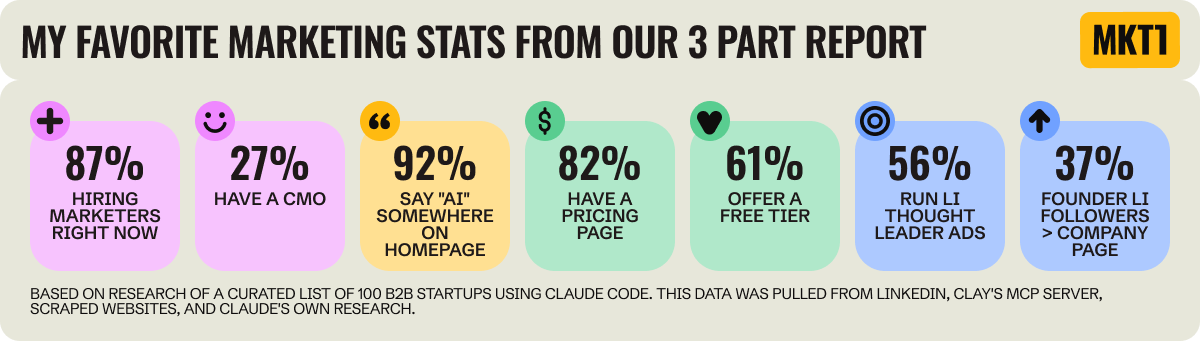
➜ We’re all AI platforms now: 92% of B2B homepages say “AI” & 66% say “platform”
75% companies say “agent” or “agentic” on the homepage: 52 say “agent” only, 19 say both “agent” and “agentic.”
Only 5 of the 100 companies don't mention AI or agents anywhere on the homepage: Obsidian, Omada Health, Pulley, ServiceTitan, and Tracksuit. I respect the holdouts!
And please, can we stop saying "revolutionize" (3%), "game-changing" (13%), and "democratize" (5%)? And enough with "seamless" (30%) too.
Does everyone finally have a pricing page?
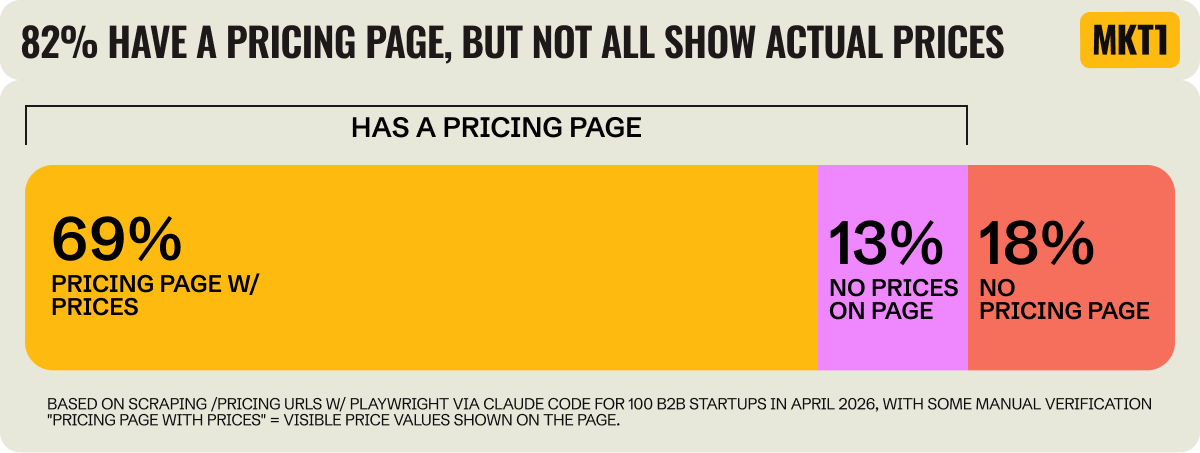
➜ Good news: 82% B2B companies (finally) have a pricing page
Most starting tiers are $10-30/mo.
The lowest seat-based price is ClickUp at $7/user/mo.
Together.ai deals in cents: $0.02 per million tokens.
And Pulley is refreshingly straightforward and gives you the price annually: $1,200/year for equity management.
More money raised = less likely to show prices. 90% of companies in the $50-100M raised range show prices, but only 57% at $500M-1B do. The enterprise sales playbook takes over once you raise serious money.
Oddly, public companies bounce back to 80%, but that's because 4 of the 5 publics in our sample are hybrid. Let’s break things down by GTM motion a bit more…
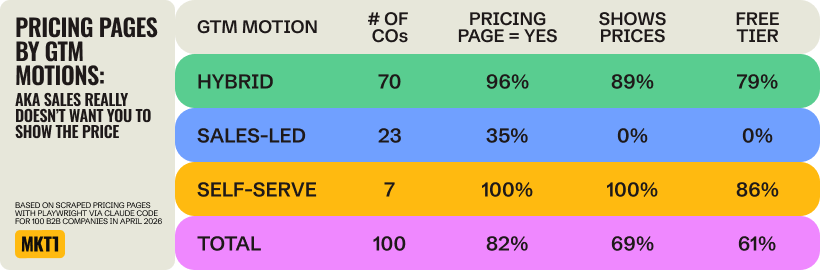
➜ Sales-led companies are afraid to get specific (again): 0% show actual prices
GTM motion is almost a perfect predictor of having a pricing page!
But also, sales-led companies: We’re going to ask an LLM for your pricing anyway—it might as well be available and accurate on your site. I wrote about this forever ago and can’t believe this is still a debate.
Is usage-based pricing taking over?
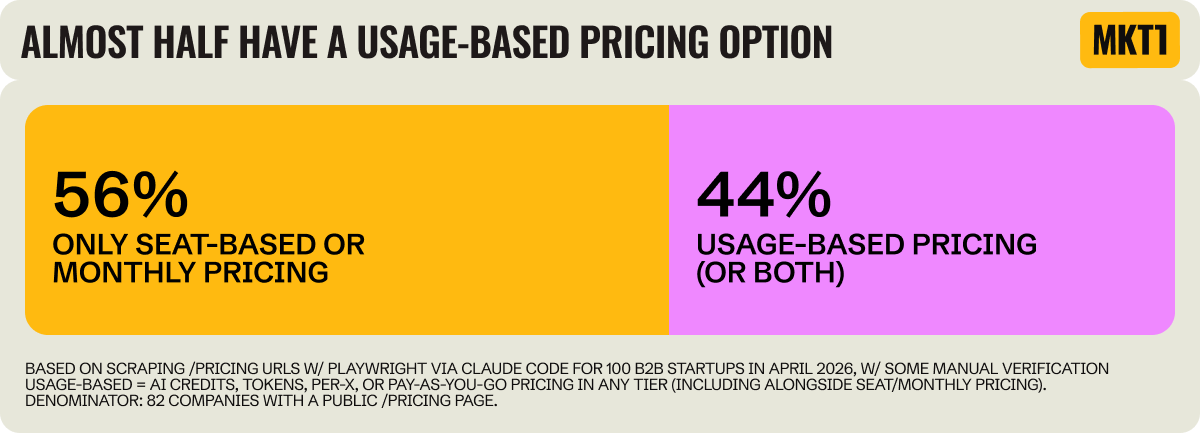
➜ More companies are moving to pay-as-you-go pricing to cover AI usage costs
36 total companies have usage-based pricing.
28 companies (34% of companies with a pricing pages) have only usage-based pricing.
9 (11% of companies with a pricing page) have both usage-based and seat-based pricing.
Companies in 7 of the 8 categories have at least one company with usage-based pricing. Design & video companies use this pricing model most often (75%), while 0 vertical industries companies have usage-based pricing.
There are various types of usage-based pricing: Together.ai (per token), Stripe (per transaction), and Intercom + Fin (per outcome, billed per AI-resolved ticket).
🥤 TAKEAWAYS FROM STATE OF WEB:
The B2B website is finally getting cheaper and faster to build, but companies are still on their legacy CMS or custom-coded site (39% all-in-one, 38% headless, 23% custom).
Meanwhile, sales-led companies are still doing the same thing they've always done: hiding pricing and product screenshots. I think this is actively costing them revenue. Conversion matters more than ever as web traffic and inbound decrease, and buyers are getting impatient—especially when 77% of B2B startups offer a self-serve option.
The state of B2B social
Social is undergoing a shift right now: Human influencers on social are becoming more important than companies on social. And not just for organic. LinkedIn even has thought-leader ads to promote individuals' posts. To see how that's actually playing out, I pulled LinkedIn followers (company + every founder), Twitter followers, and LinkedIn ad activity for all 100 companies.
🎯 MY FAVORITE STAT:
60% of founders at companies under $100M raised have more LinkedIn followers than their company page. After $100M, that drops to 3-6%.
Do founder LinkedIns matter more than the company LinkedIns?
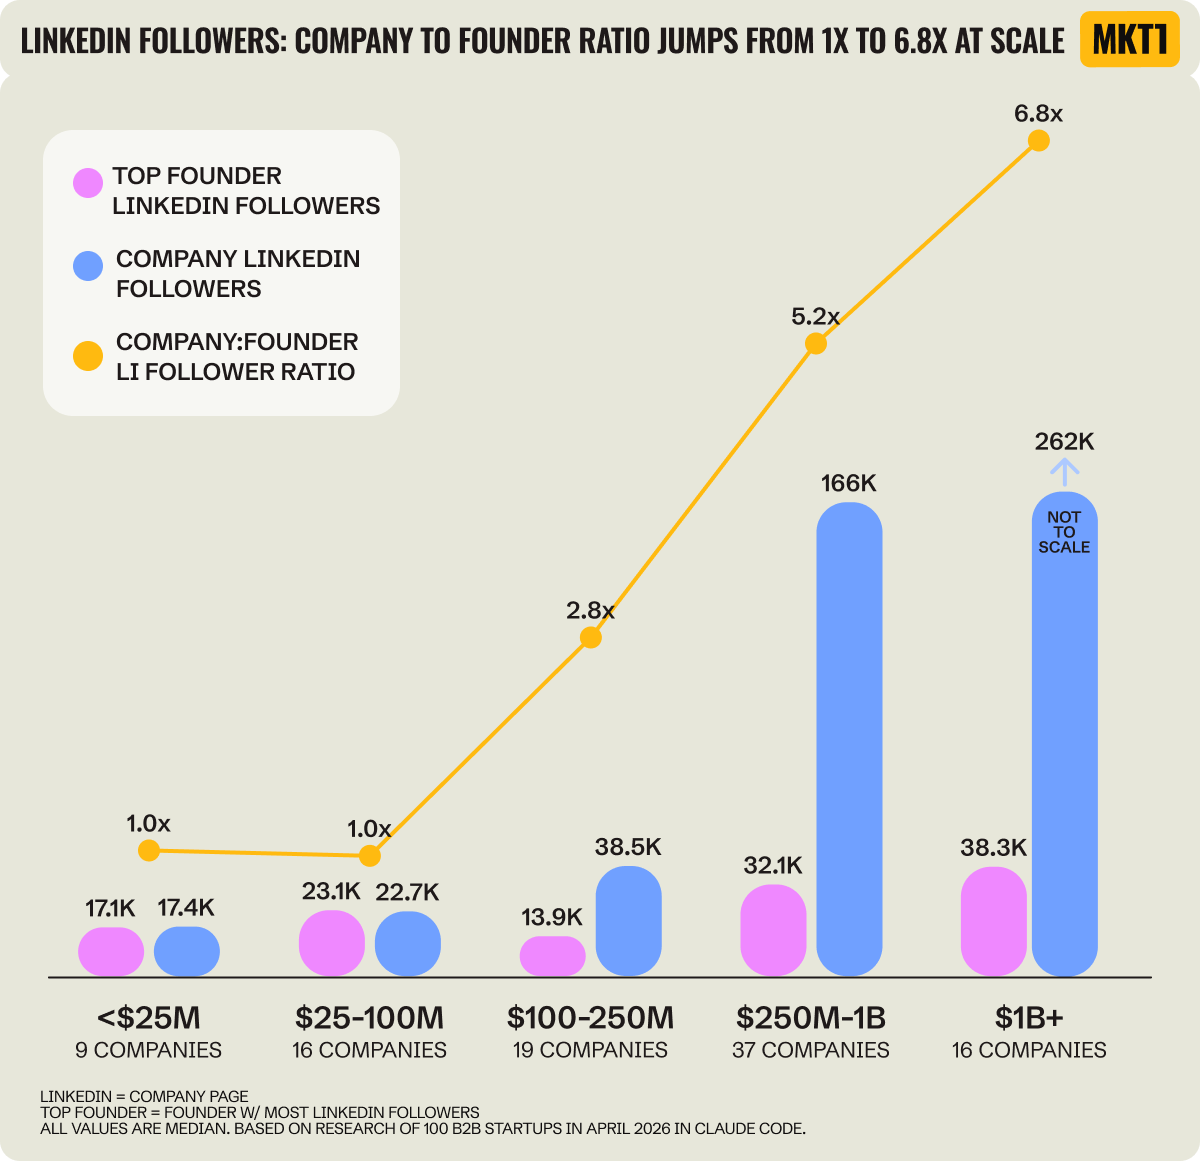
➜ Under $100M raised, the founder LinkedIn beats the brand. After $100M, the company LinkedIn explodes.
Early-stage, followers are split roughly 50/50 between founder and company.
The company-to-founder follower ratio (the mustard-colored dots and line on the chart above) jumps from 1.0x at $0 to 100M raised all the way up to 6.8x at $1B+.
Companies where the founder following still exceeds the company following in followers include Relay.app, Unify, Mutiny, and Sierra.
And it’s almost always one founder carrying the social weight, not both. The median top founder has 22.1K LinkedIn followers. The median across ALL founders combined is 25.8K So 2nd and 3rd founders only add ~17% on top of what the top founder brings.
Caveat: Many late-stage companies built their LinkedIn following back when company accounts were the easier path. Now LI seems to favor individuals.
Is Twitter* still alive for B2B? (For some categories, yes)
* Don’t make me call it X
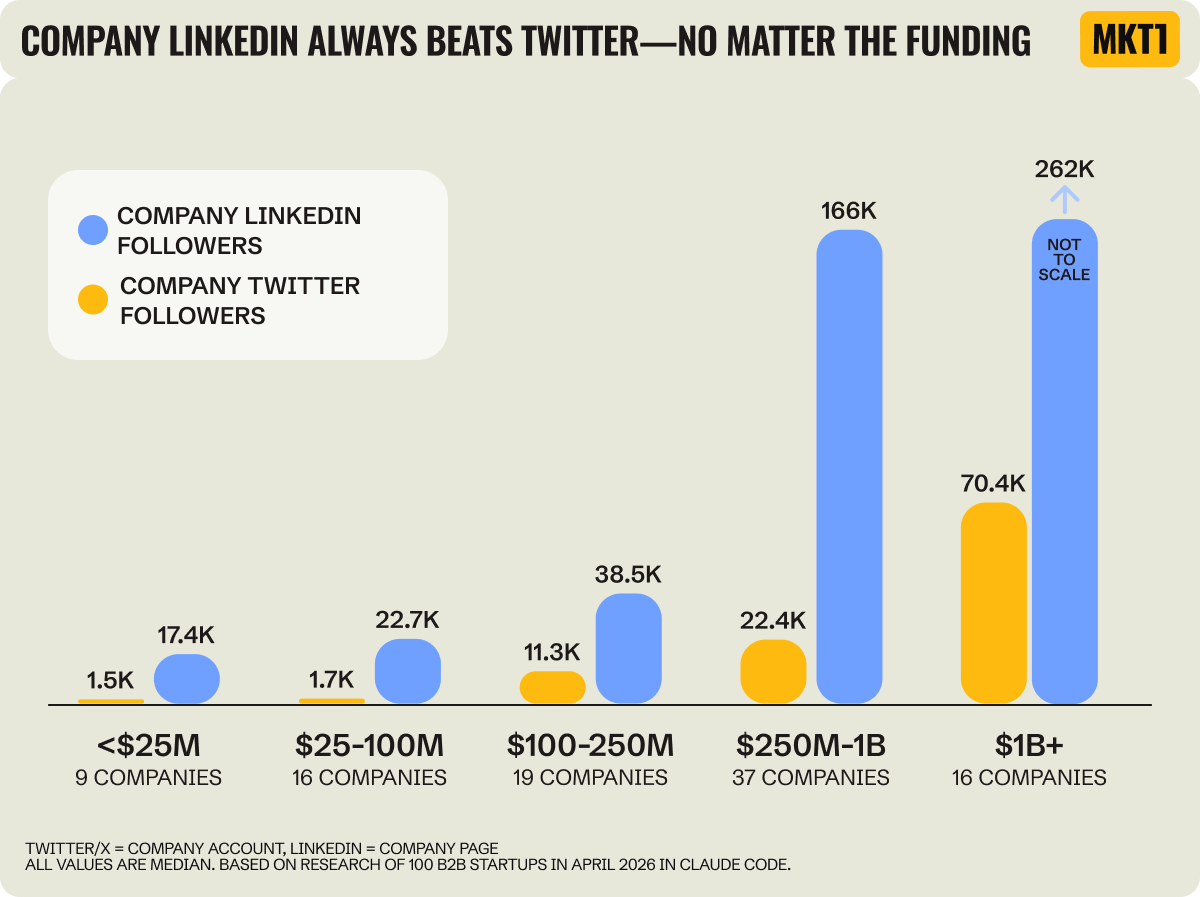
➜ LinkedIn beats Twitter at every stage
Across all 100 companies, the median company has 6.6x more LinkedIn followers than Twitter followers.
Not a single category breaks the pattern, the blue LinkedIn bar is taller in every bucket on the chart.
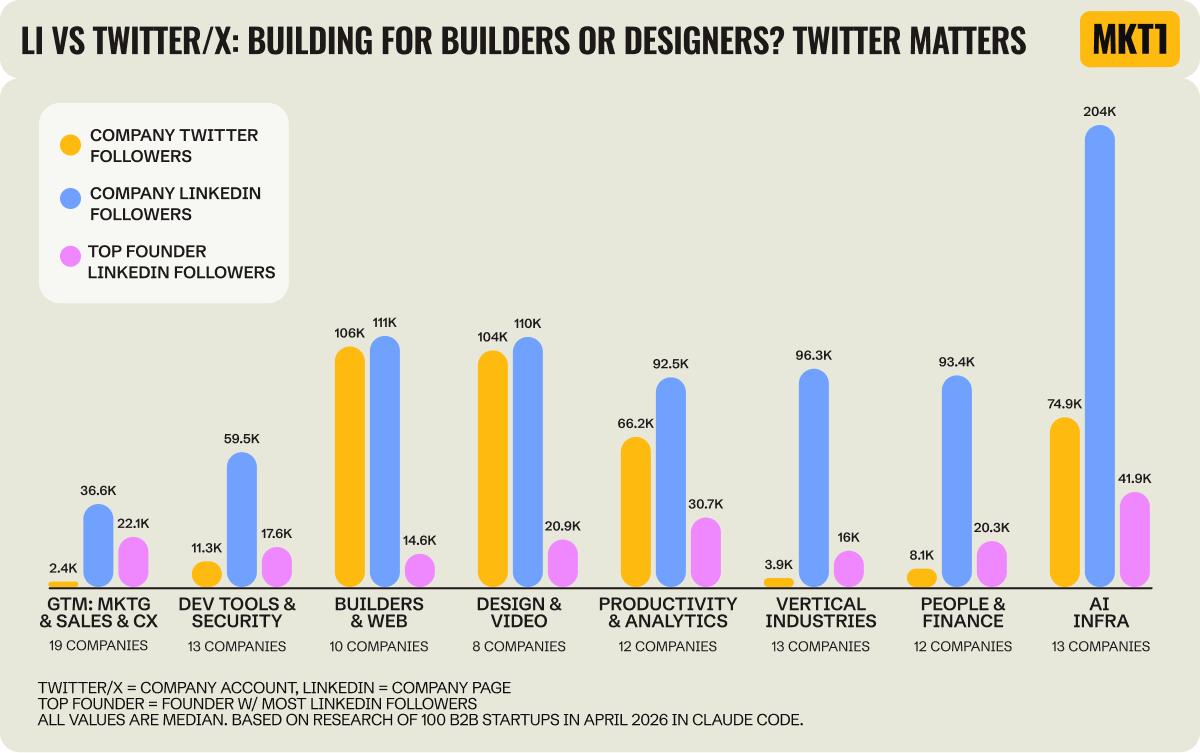
➜ The pattern: technical and creative audiences are on Twitter. Business buyers are on LinkedIn.
Twitter works in 4 categories: Design & Video (104K median), Builders & Web (106K), AI Infra (75K), and Productivity & Analytics (66K).
Twitter is totally dead in 4 other categories: GTM (2.4K), Vertical Industries (3.9K), People & Finance (8.1K), and Dev Tools (11.3K).
Twitter follower counts vary 44x across categories (106K median at the top vs 2.4K median at the bottom). LinkedIn varies just ~6x. So Twitter is the much more category-dependent platform.
OpenAI has 4.8M Twitter followers, the biggest in the dataset. Anthropic is 2nd at 1.2M. The AI labs in this study are the only ones with truly massive Twitter accounts.
Note: I had to update the LinkedIn and Twitter followers graphs and data from the original newsletter. The narrative remains the same, but Claude had filled in estimates when it couldn't find a number rather than flag the issue. We're all learning how to do research this way and I apologize for the error!
How prevalent are LinkedIn Ads in B2B?
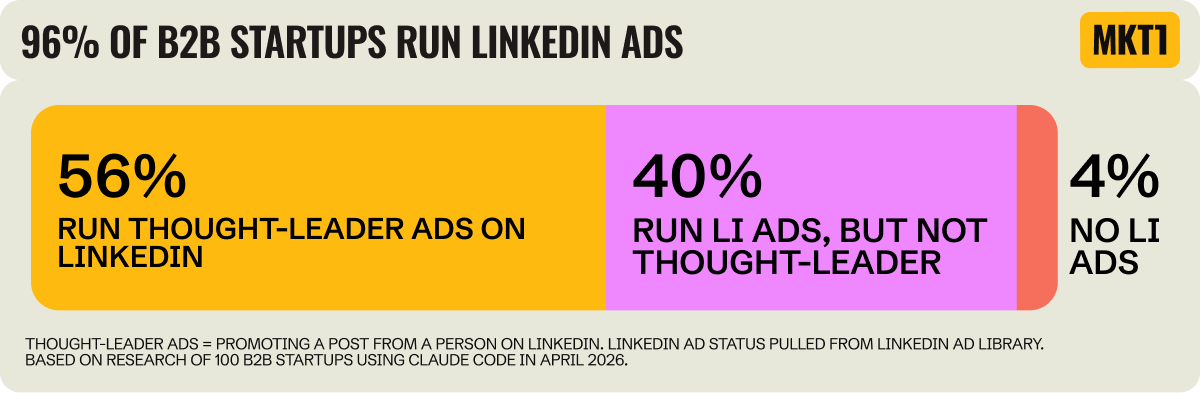
➜ Almost everyone runs LinkedIn ads, but only 56% have figured out thought-leader ads
The median company in our sample has 386 ad creatives visible in the LinkedIn Ad Library (which tracks the last 12 months). Three companies have over 10K: Canva, Rippling, and ElevenLabs.
2 of the 4 companies skipping LinkedIn ads have built major organic presences.
Relay.app‘s founder has 70K LinkedIn followers (10x the median for sub-50 companies)
Obsidian has 203K Twitter followers (135x the sub-50 median).
Note: You can pull this info yourself from the LinkedIn Ad Library, or ask Claude Code or Cowork to do it. I’ll share more on how I pulled the data in part 3 of this series.
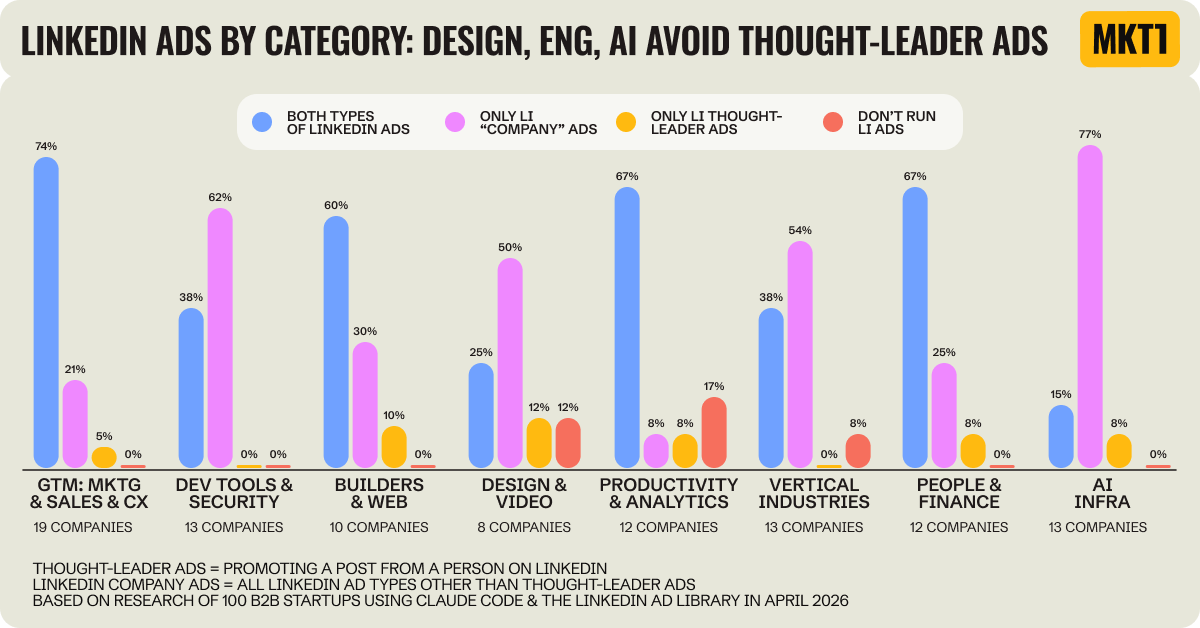
➜ Who’s figured out that LinkedIn thought-leader ads typically outperform other LI ads?
Companies in the GTM category run thought-leader ads at 74%. There are lots of influencers in this category, and brands are likely amplifying their posts as paid ads.
Surprising pattern: Companies in the AI Models & Infra category have the biggest founder LinkedIn followings (41K median, ~2x other categories) but the lowest LI thought-leader ad adoption (23%). The personal brands are massive, but they're not turning them into paid amplification—maybe they should?
This made me curious: Do companies outside AI Models & Infra with big founder followings run thought-leader ads? Most likely. When you exclude that category, 60% of companies with above-median founder followings (>22.1K) run thought-leader ads vs. 52% for lower founder followings.
Need help with Linkedin Ads?
More on how to use thought-leader ads in my LinkedIn Flywheel newsletter ➜
Call Max and August at Closing Media. They're a long-time partner of mine and a sponsor of this report.
🥤 TAKEAWAYS FROM STATE OF SOCIAL
The future of B2B social is less “should I be on LinkedIn” and more “whose voice are we using, and where else do my buyers hang out?”
Currently, LinkedIn dominates. But with 96% of companies running LinkedIn ads, just being on the platform isn't differentiation anymore. The teams that stand out are leaning into growing founder followers and thought-leader ads to put individual voices forward (but still only 56% of B2B startups are using these).
Depending on your audience, it may make sense to add or expand other social channels: Twitter for designers and builders, Reddit and YouTube for technical buyers, and maybe even TikTok for some audiences? maybe?
The state of marketing fuel
Last up in this report, the state of marketing fuel. By "fuel" I mean content broadly: blogs, events, communities, newsletters, podcasts. I was particularly curious about two observations: that events are on the rise, and that while everyone's talking about AEO, many are still behind on actually readying their websites to be read by LLMs.
🎯 MY FAVORITE STAT:
Only 2 companies have a truly AEO-ready website.
Are we still leaning on blogs?

➜ Companies are still posting to blogs regularly
100% of B2B companies have a blog, 90% posted 2+ times last month. The median for post per month is 9. This was higher than I thought, I guess the blog isn’t dead yet…
A better question might be how many of these blog updates are written for humans to read, not crawlers? How many are truly editorial? I didn’t go deep here (yet), but here’s a directional estimate based on the scraped data:
~10-15 companies’ blogs are mostly AI-written posts for crawlers to read — not for humans
~25-35 lean heavily on this AI-for-AI content, even if mixed with editorial
Note: I had to update this graph and data from the original newsletter. The original scrape couldn’t read the dates on 9% of these blogs. Here’s why it matters:
Dates on blogs that load via JavaScript instead of being baked into the HTML aren’t readable by LLMs.
While this messed up my report, it has a bigger implication for these companies: their content looks stale to AI, which hurts AI visibility and search rankings.
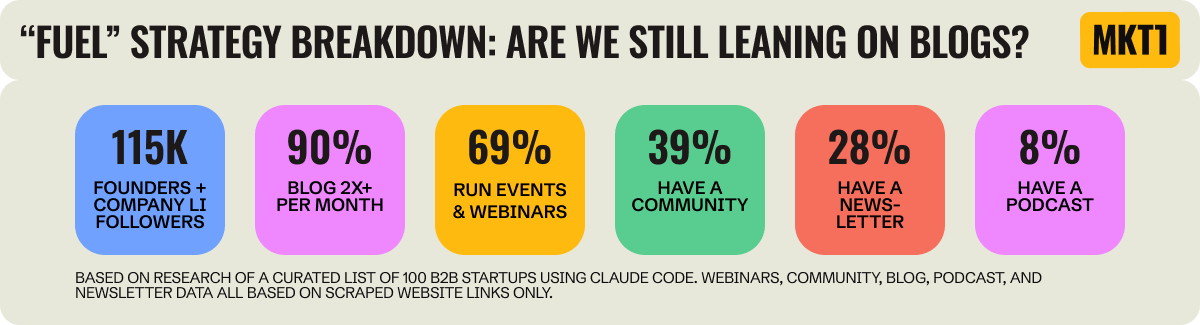
➜ Beyond blogs, companies lean on events (69%), communities (39%), newsletters (28%) — and very few on podcasts (8%)
Companies with sales-led GTM motions over-index on events (78%). This makes sense: Longer sales cycles and higher contract values mean relationship-building is essential.
Only 8 companies have a podcast, those that do are mostly in GTM and Dev Tools categories.
Channel mix: Only 1 company runs all 4 (events + community + newsletter + podcast). 20 companies run NONE. Most stick to 1-2 channels.
Caveat: We measured if companies have events, communities, newsletters, and podcasts based on if their homepage or footer has a relevant link. This may miss some.
➜ Communities and newsletters are most popular at product, eng, and design-focused companies
The biggest divide: Community.
61% of companies in these categories (Builders, AI Infra, Dev Tools, Design) have a community.
But only 23% of other companies (in GTM, People & Finance, Vertical, Productivity categories) have a community.
Having a newsletter has the second-biggest gap (41% vs 18%).
Builders & Web (70%) and AI Infra (62%) categories lead on community. People & Finance is at 0%. Not a single one of the 12 companies in that category has a community, which is surprising. I thought HR leaders sought community.
LLMs are a distribution channel now; are our websites ready?
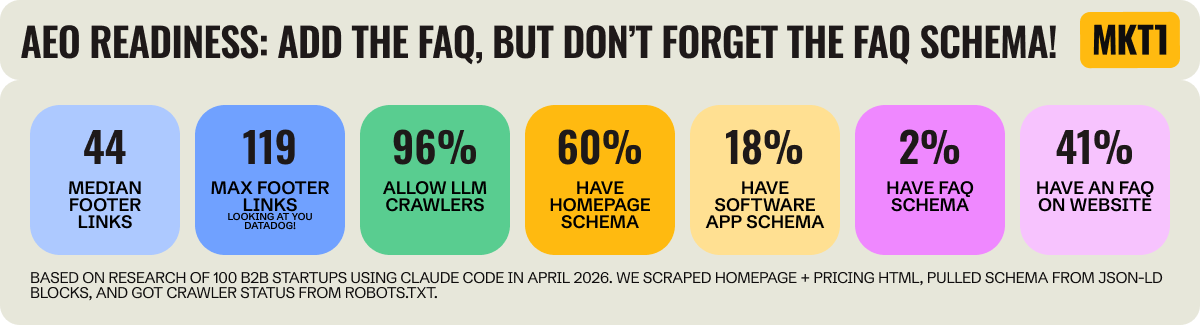
➜ Less than 2% of B2B startups in our sample have all the AEO basics in place
We measured AEO readiness through a few scrape-able signals:
FAQ on the site (41%), FAQPage schema, the markup that tells LLMs your FAQ is in Q&A format (2%)
Organization schema and SoftwareApplication schema (18%), which tell LLMs details about your company and that you're a software product. You can figure out all the schema types at schema.org
Robots.txt rules for LLM crawlers
Footer link counts as a proxy for internal linking (median footer links = 44)
The median B2B footer has 44 links; Datadog tops the list at 119. Sites with few or zero footer links make it hard for crawlers to discover deep pages, which hurts both SEO and AEO.
97% of B2B sites let LLM crawlers in (3 block GPTBot, only 2 block ClaudeBot).
Attio is doing something smart here: They block CCBot (which feeds Common Crawl, the source of most LLM training data) but allow GPTBot and ClaudeBot. Translation: Don't train on us, but do cite us in real time.
➜ FAQ text is everywhere, FAQ schema is nowhere; only 2 companies have both
The 2 companies hitting both: Puzzle and Klaviyo. Everyone else has the FAQ content in plain HTML, which LLMs parse less reliably than structured FAQ schema.
This is the easiest AEO fix on the list: Adding FAQ schema takes about 15 minutes and immediately makes the content machine-readable.
FAQs are most common in self-serve GTM motions (71%) and the Builders & Web category (60%). The most behind are surprisingly Dev Tools (15%) and unsurprisingly Vertical Industries (31%).
🥤 TAKEAWAYS FROM STATE OF FUEL
We’re seeing more and more content written by AI for AI to read. ~10-15 of the blogs we researched are mostly programmatic; another ~25-35 lean that way.
At the same time, AEO preparedness is lacking for most companies. Less than 2% of companies have the basics — machine-readable dates, FAQ schema, structured data.
Other stats I wish I had time to research…
I had to draw the line somewhere. Here’s what I didn’t get to but would have liked to. The good news is you can pull any of these yourself in Claude Code with our 2 new MCP skills!
Demo request form fields and form types
Whether companies offer a “book a meeting directly” option in the demo request flow
Reddit presence: how many companies have a dedicated subreddit, and how many run Reddit ads
YouTube channel activity (subscribers and posting cadence)
Mentions in LinkedIn posts and sponsored LinkedIn posts
Ads tracking beyond LinkedIn (base on pixels)
LinkedIn Thought-leader ads broken down: promoting an employee post vs. an outside influencer post
Types of blog posts that are most common now (launches, thought leadership, customer stories, etc.)
Events: Webinar frequency and whether the company runs its own conference
Explore the data and do your own research with the MKT1 MCP Server
/state-of-b2b-marketing
Query the full dataset behind this report: 100 high-growth B2B startups, 100+ data points each, covering GTM motion, team composition, open roles, social, ads, homepages, CMS, conversion, and AEO readiness./high-growth-b2b-company-list
My curated list of 150 high-growth B2B companies ready as a reference set. Run quick research across a known-good list instead of starting from scratch every time.
Plus a bunch more skills in the MKT1 MCP:
Up next: Part 3 of the State of B2B Marketing Report
Part 3 next week will cover my advice for doing research, building reports, and shipping research as a Claude skill. If you want to do this type of report or expand on my research, don’t miss it!
For more stats and graphs, don’t miss part 1 of this report covering marketing teams, leadership, and hiring data.
Even more from MKT1
🙏 Brought to you by: Framer, a no code website builder; Closing Media, a LinkedIn & Paid Media Agency; and UserEvidence, a customer evidence and advocacy platform. All 3 companies have offers for MKT1 subscribers!
🤖 MKT1 MCP Server: Add MKT1 skills to Claude Code and Cowork. Paid subscribers get our full library of skills and templates, including the 2 new research skills used in this newsletter.
🧑🚀 MKT1 job board - new & improved: Jobs from the MKT1 community (it’s free to post as a paid subscriber). And our candidate form if you’re looking for a new role (option to remain anonymous included!).
👩💻 MKT1 Buildathons: Missed our first Buildathon? Watch the replay to see how to build a /marketing-strategy-skill in Claude Code. Want in on the next one? Get on the waitlist.
📦 MKT1 Unboxing: Watch our video series to see Kramer (that’s me) unbox Mutiny, Wistia, Luma AI, & Attio.
🥞 MKT1 Perk Stack - New Perk: Exclusive discounts worth $40K+ on our favorite GTM tools. For annual & superfan paid subscribers only. We just added 3 months free of Granola, check it out!
🧰 Template & resource library: We have 100+ templates and resources available to paid subscribers in our template & tool library.
Join our Slack Waitlist
Good news, we’re launching a Slack just for talking about using Claude Code or Cowork and/or our MCP Server. It’s invite-only for paid subscribers using the MKT1 MCP Server users. Get on the list ➜