


👋 This is a bi-monthly free edition of MKT1 Newsletter—a deep dive into a B2B startup marketing topic, brought to you by Algert, Profound, and Closing Media.
⬆️ Upgrade to a paid subscription for: Full access to our MKT1 MCP | 100+ templates & resources | Post to MKT1 Job Board | MKT1 Newsletter Archive | $40K+ in discounts in the MKT1 Perk Stack
🩷 RSVP: MKT1 x Lovable Buildathon on 10/28 at 10AM PT. Come build apps and MCPs alongside Kramer and the Lovable team. RSVP ➜
I get heated when marketers get paid unfairly. We're often paid less than other roles, despite how much revenue we drive and how much scrutiny our work gets. It's even harder when you don't know what to expect or what to ask for, and most of us don't, especially "in this economy."
I've been on every side of this: I've been paid unfairly myself, set comp for roles as a team lead, helped hundreds of people negotiate their salaries, led marketing at a compensation startup, and even thought about launching my own comp startup pre-MKT1.
That brings me to this report. Four and a half years ago, when MKT1 Newsletter was just a toddler, I wrote a newsletter about early-stage marketing compensation. It's the newsletter people ask me to update second most often (after the org chart ones!). Now that MKT1 Newsletter is a young adult, it's both more possible and more important to build a salary report like this:
Most job posts now list salary. When I wrote the 2022 newsletter, only Colorado's pay transparency law required this. Now more and more US states require companies to list salary, and 87% of the open marketing jobs I checked include a salary. Now can we require this for equity compensation too?!
I can analyze publicly available data at scale. With Claude Code and the research skills from my State of Marketing report, I can research hundreds of companies and make the graphs in a few workdays. You can too, and I’m even sharing the updated research skill I used in the MKT1 MCP.
Startup valuations are all over the map, which makes it especially hard to value equity. AI startups have multi-billion-dollar valuations that seem to go up by the day, while private equity buys SaaS startups for way less than their peak valuations. Don't worry, I'm not going to write yet another think-piece about Bending Spoons.
A few companies (OpenAI & Anthropic especially) pay really high salaries for every role. Should this impact what you ask for at other AI startups?
Entry-level jobs are scarce, and getting any job is hard. Should we just take what we can get?
So I built this analysis based on 1,100+ marketing job posts, 794 from private B2B startups. I hope this serves as a reference when you ask for a raise, get an offer, or make an offer. Here are the stats that stood out most:
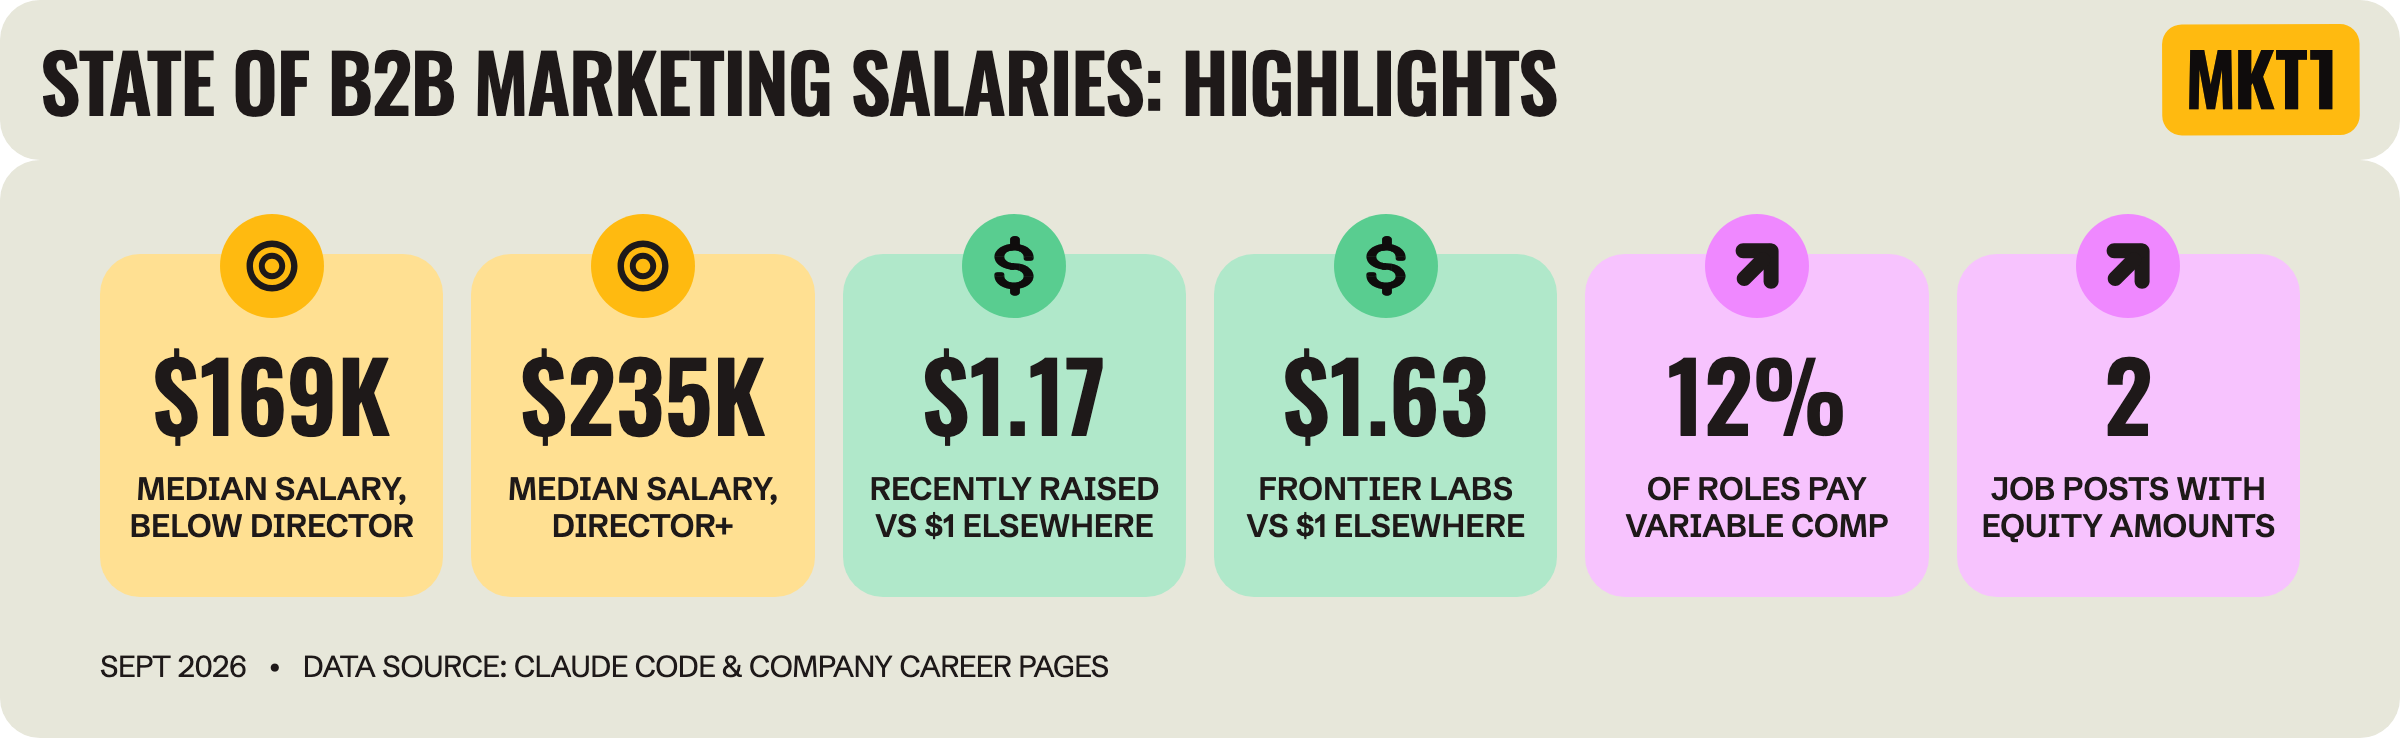
The median salary is $169K for jobs below Director and $235K for Director and above, so moving into a leadership role is worth about $66K. But only about 1 in 5 job posts is Director or above (169 of 794), so there are far fewer of these jobs to go around (and to analyze).
The fastest path to more salary for the same level, besides getting a job at OpenAI or Anthropic, is to join a startup that raised money in the last year: They pay about 17% more. Note: The green $1 cards show what a job pays for every $1 you’d get at the same level elsewhere.
As for the other parts of comp, bonus and equity: Only 12% of marketing job posts mention a bonus or commission on top of base, and about 1 in 3 of those hedge it with something like "may be eligible." About 64% of job posts mention equity, but I could only find 2 job posts (not a typo, actually just 1+1) that stated an equity range.
Let’s get to the data!
Recommended products & agencies
We only include sponsors we’d recommend personally to our community.

Algert is the creative partner for ambitious B2B marketing teams: Brand strategy, design, web, and ongoing creative support. They take your brand from strategy to launch, without the cost of building it in-house.
🎁 Offer: Mention MKT1 for 10% off a Brand Revamp or 3 months of a new retainer (thru 10/31).
—
Profound, the AI marketing platform, just raised a $180M Series D to double down on Aim, their AI Marketer. Aim identifies work worth doing, drafts it, and pings you for approval, all based on AI citation data and your team’s context. Used by Ramp, MongoDB & Zoom.
—
Closing Media is a boutique agency that runs LinkedIn and Google campaigns for growth-stage startups. They know the best ways to build and scale ad campaigns in 2026 (hint: Thought leader ads and video) and have years of expertise (I worked with them in 2018!).
🎁 Offer: Reach out to Closing Media here & mention MKT1 to get $5,000 of free ad spend for your next campaign.
In this newsletter:
This is the 1st in a 2-part series, and it has 20+ graphs about the current state of marketing salaries, based on live job posts from Sept 2026.
Salary data from 1,100+ marketing job posts (794 from private B2B startups)
By area of marketing, from generalists to ecosystem marketers
By company: Location, OpenAI & Anthropic, AI-native and fundraising
Equity by stage and what you need to evaluate an equity offer
Appendix for paid subscribers: More salary graphs: Variable comp, company size, stage, funding and category
The skills behind this report: Search open jobs for free, or access all the data and run the research skills behind this report (paid subscribers only). Install the MKT1 MCP.
Coming next, Part 2: Open Roles Data.
When making this salary report, I accidentally (and then on purpose) gathered a bunch of data on the state of open jobs for marketers at B2B startups, so this topic demands a Part 2!
Subscribe to get Part 2 in your inbox.
Salary data from 1,100+ marketing job posts
This section answers questions like: What should you get paid at your level and for your years of experience? How much does salary change at each level?
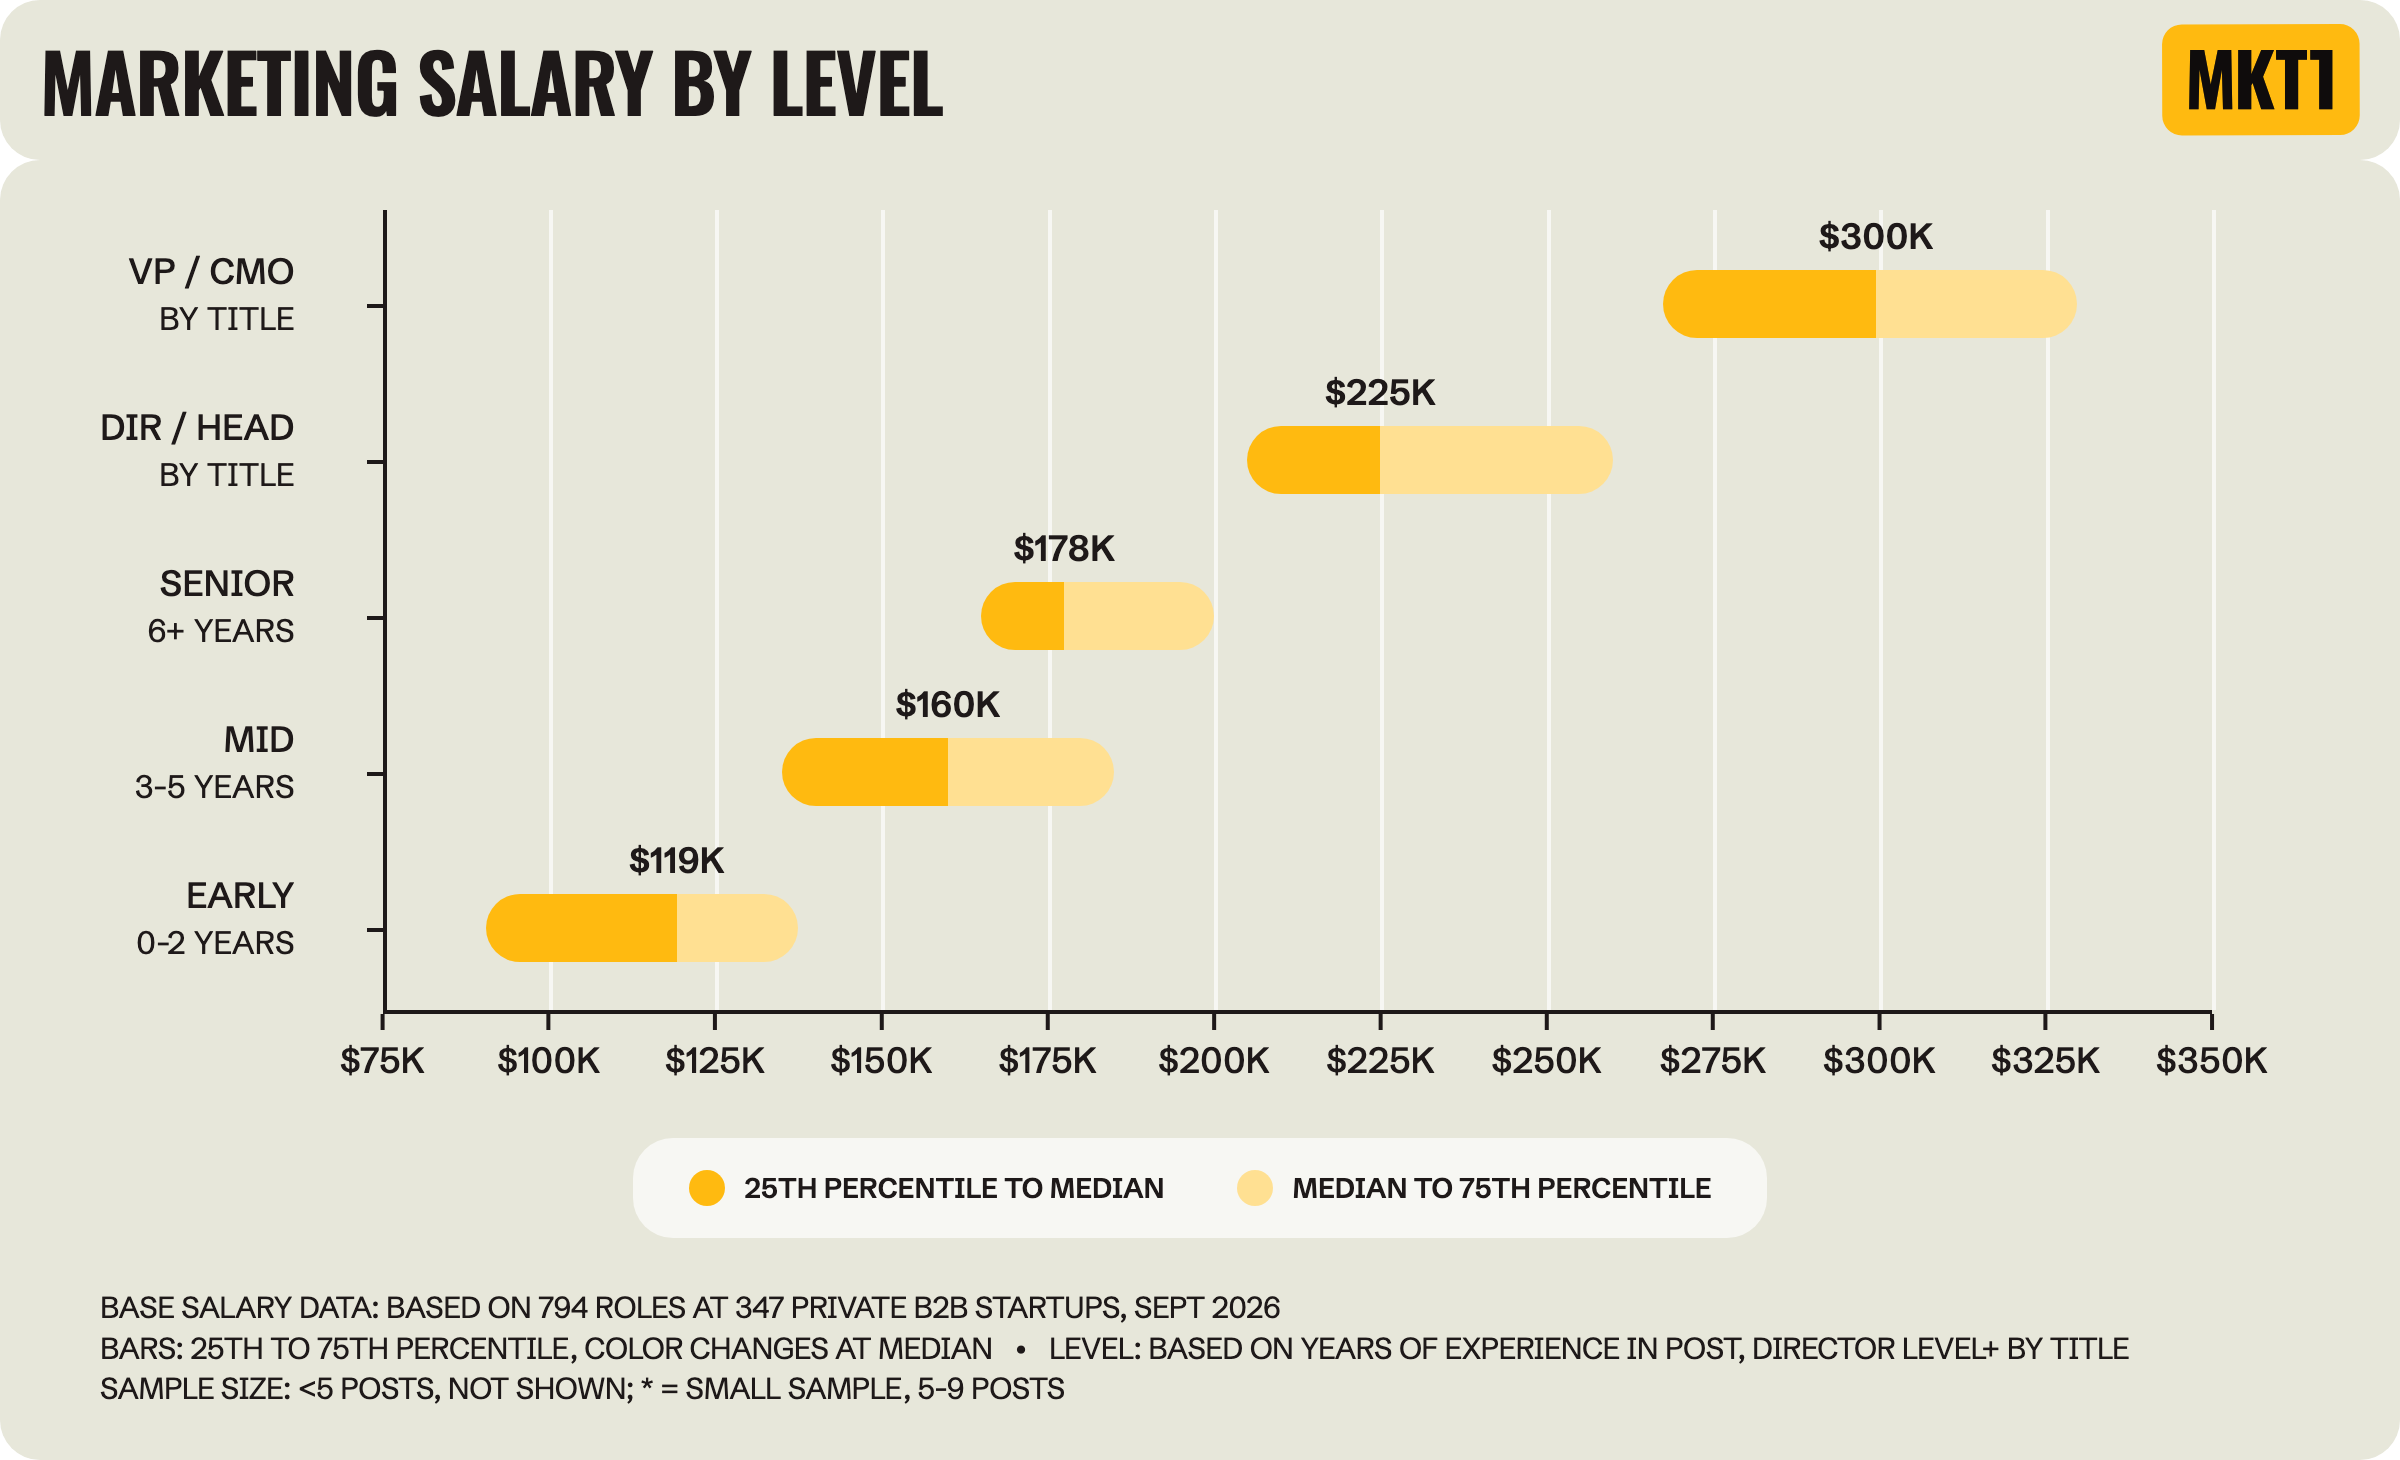
The median base salary grows 2.5x+ from early-career roles through marketing leadership roles at the VP and C-level.
The biggest salary jump happens when you move from Director or Head of to VP or CMO (not a surprise): VPs & CMOs make a median of $300K vs $225K for Directors / Heads of, a $75K or 33% increase.
The actual increase is likely higher because my sample is mostly VPs, since most CMO roles aren't publicly posted...
...Or startups just try to get away with not hiring a CMO and keeping marketing a VP-level thing, more on that in Part 2 of this series!
You don't have to lead all of marketing to get a VP-level salary. VPs of Growth and VPs of Product Marketing make about $69K more than Directors in their area.
If we just look at VPs of Marketing, they make a median of $313K (up from $300K when you combine all types of VPs).
Going from early career to mid-level is a big jump too: Mid-level marketers make a median of $160K vs $119K at early-career level, a $41K or 34% increase. That means the first few years of your marketing career are when salary grows fastest, until you reach leadership.
The challenge here is getting an early-career role right now to begin with. That's also a topic for Part 2 of this series.
The smallest jump is from mid to senior level, where all the roles start to blur: Senior-level marketers make a median of $178K vs $160K at mid-level, only an $18K or 11% increase. Companies don't agree on what "senior" means, so a lot of senior-level jobs are really the same work as mid-level jobs, just asking for a year or 2 more.
Mid-level salaries vary the most of any level below Director: The middle half of mid-level jobs runs from $135K to $185K, a $50K spread, while senior-level jobs are the tightest, at $165K to $200K. So at mid-level, the company you're talking to matters a lot, and 2 offers for the same years of experience can be very different.
More on why I organized levels by years of experience until Director level in the methodology summary below.
The salary ranges overlap: The top quarter of mid-level jobs make $185K or more, which is more than what the bottom quarter of senior-level jobs make (under $165K). To get paid like you have more years of experience, go to an AI-native, recently funded and/or SF-based company. They pay more at almost every level. More on this in the company details section below.
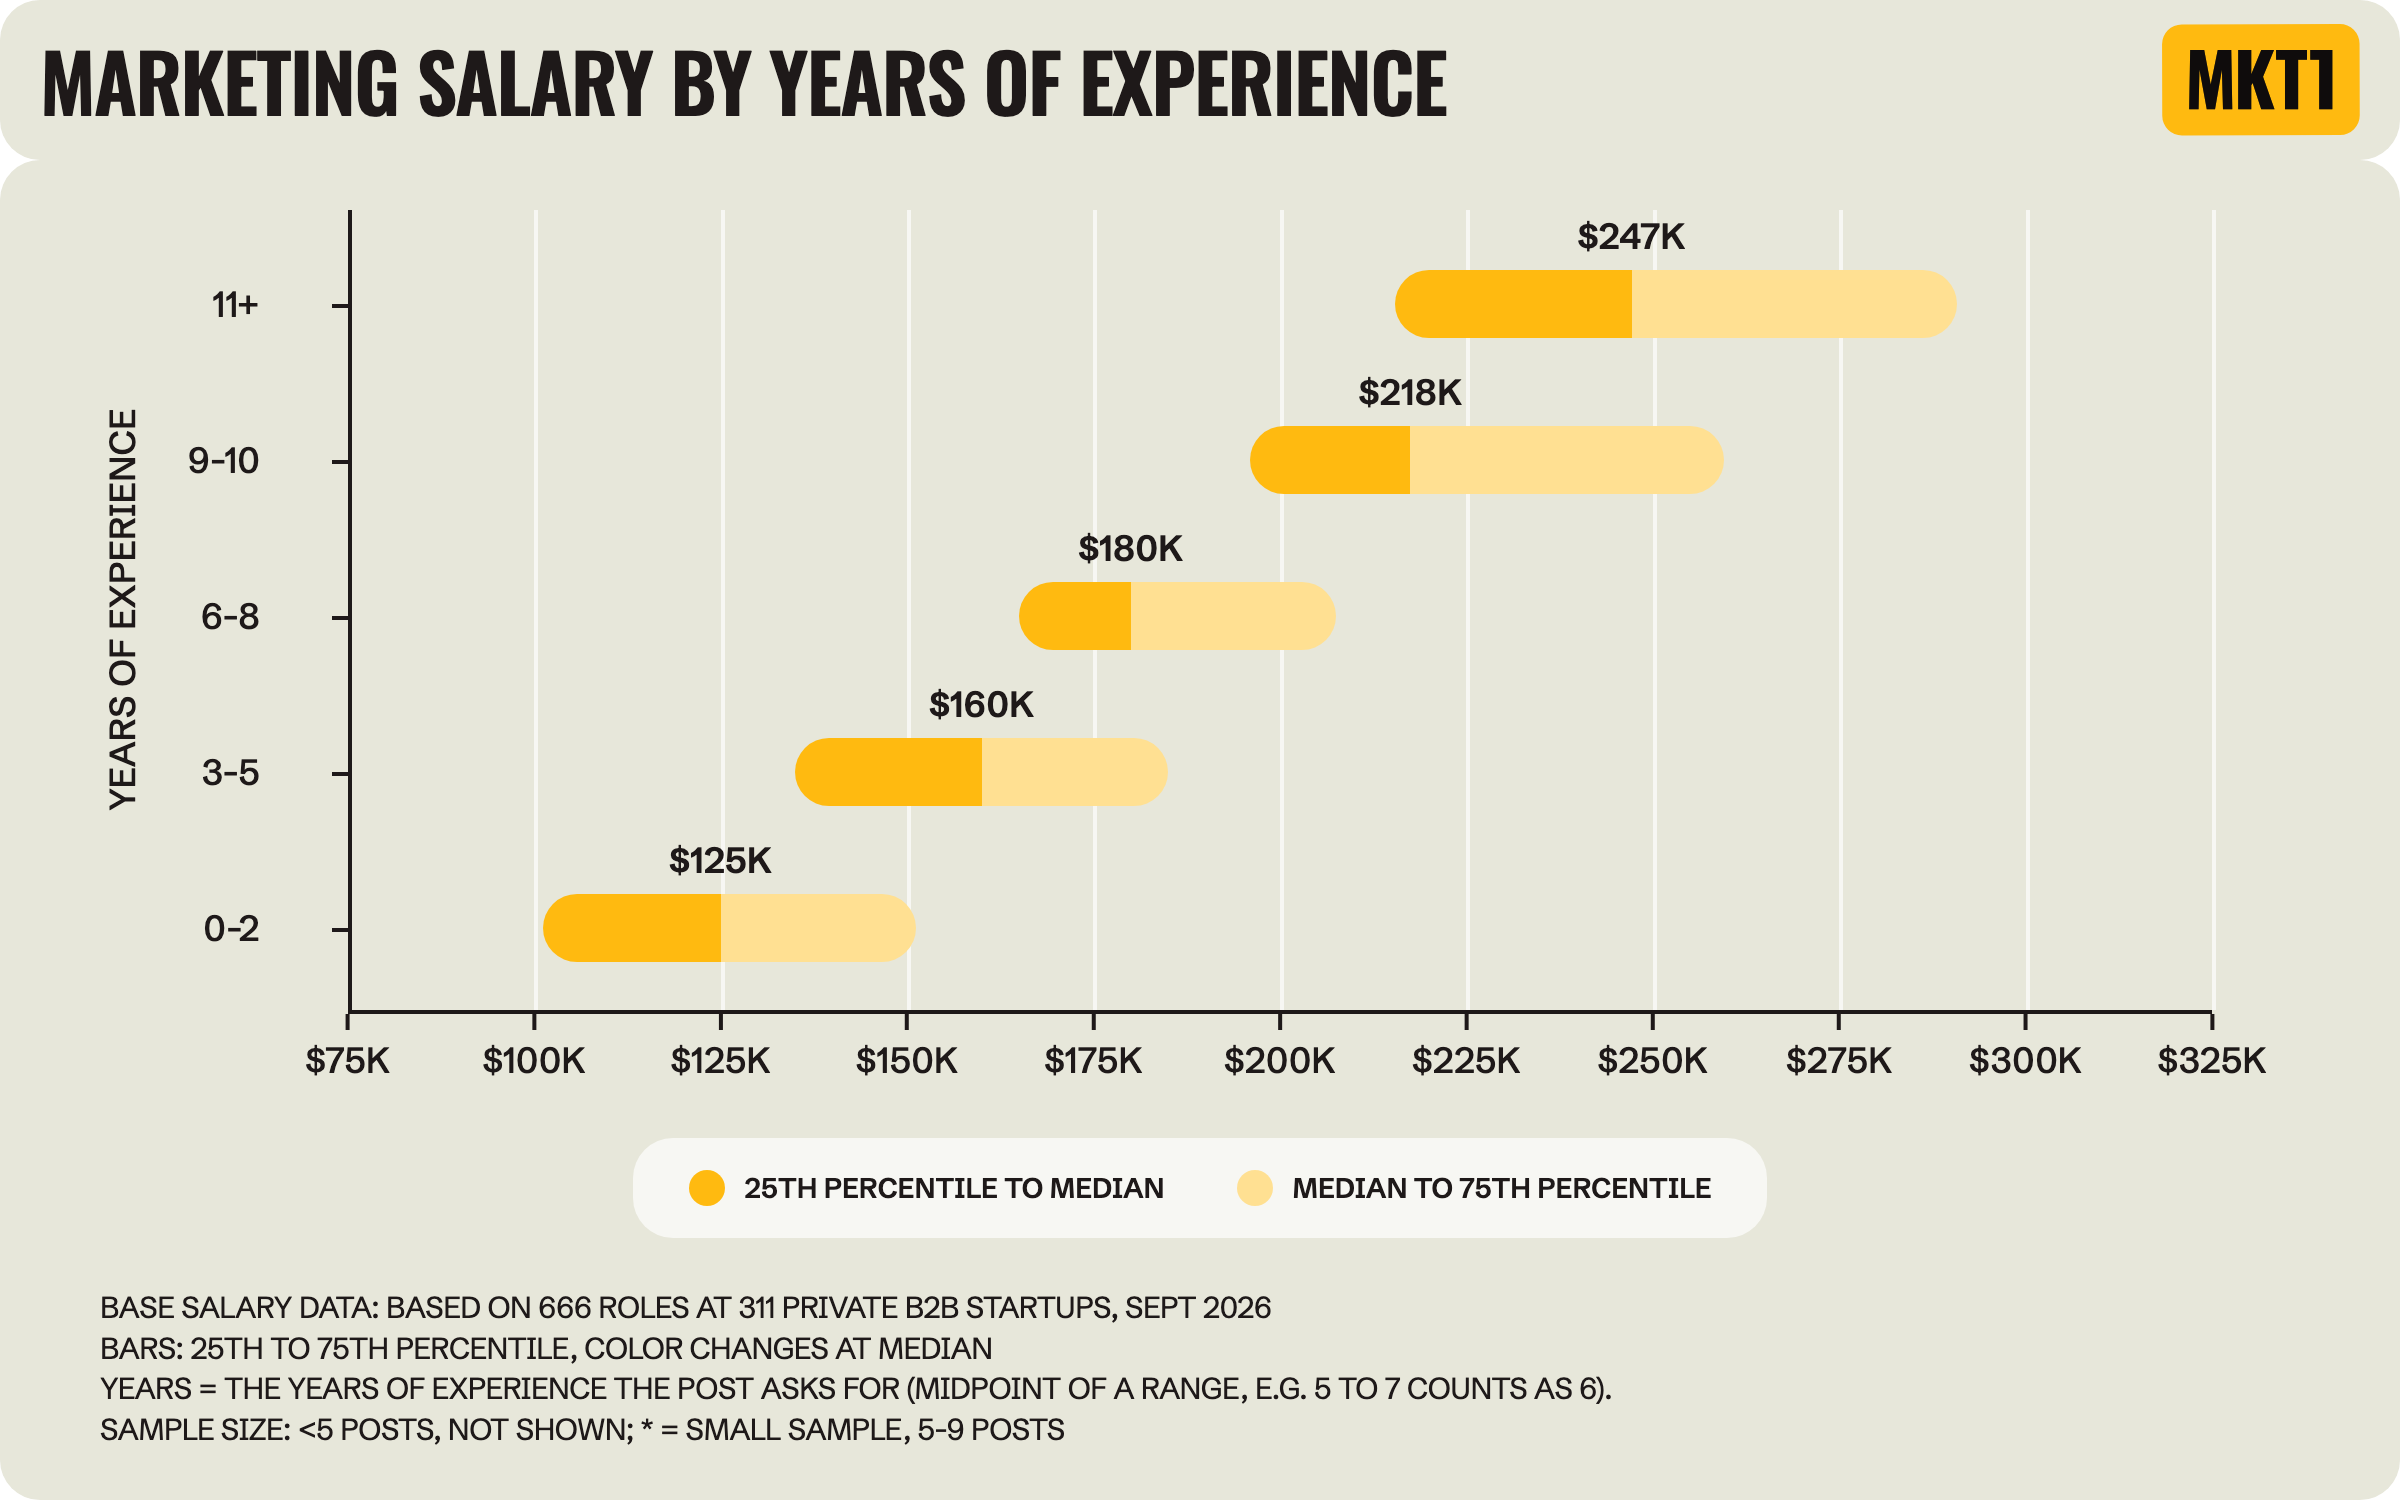
Salary about doubles from 0 to 2 years of experience ($125K) to 11+ years ($247K).
This graph uses only years of experience, with titles stripped out, even for Director and VP roles. The graph stops at 11+ because job posts rarely ask for more than 10 years, even for VP roles (only 26 job posts ask for 11 or more years).
The more experience a job asks for, the more salaries vary. At 11+ years, salaries range from $185K for a Head of Marketing at Aboon to $350K for a VP of Product Marketing at Moloco. At this point, your title matters more for your salary than your years of experience.
The smallest jump is from 3 to 5 years of experience to 6 to 8 years, only $20K ($160K to $180K). The biggest comes right after, $38K from 6 to 8 years to 9 to 10 years ($180K to $218K), likely because that's when many jobs become Director or Head of roles.
Early in your career, the title doesn't always match the job. About 1 in 2 jobs with a junior title (Coordinator, Associate, Specialist or Junior) ask for 3+ years of experience, and the median is 3 years. The title also changes the salary. Among jobs that ask for 0 to 2 years, ones with titles like Marketing Manager make a median of $130K vs $105K for ones titled Associate, Coordinator or Specialist, a $25K or 24% increase (small samples).
Notes on methodology
Before we go further, here's what you need to know to read the graphs:
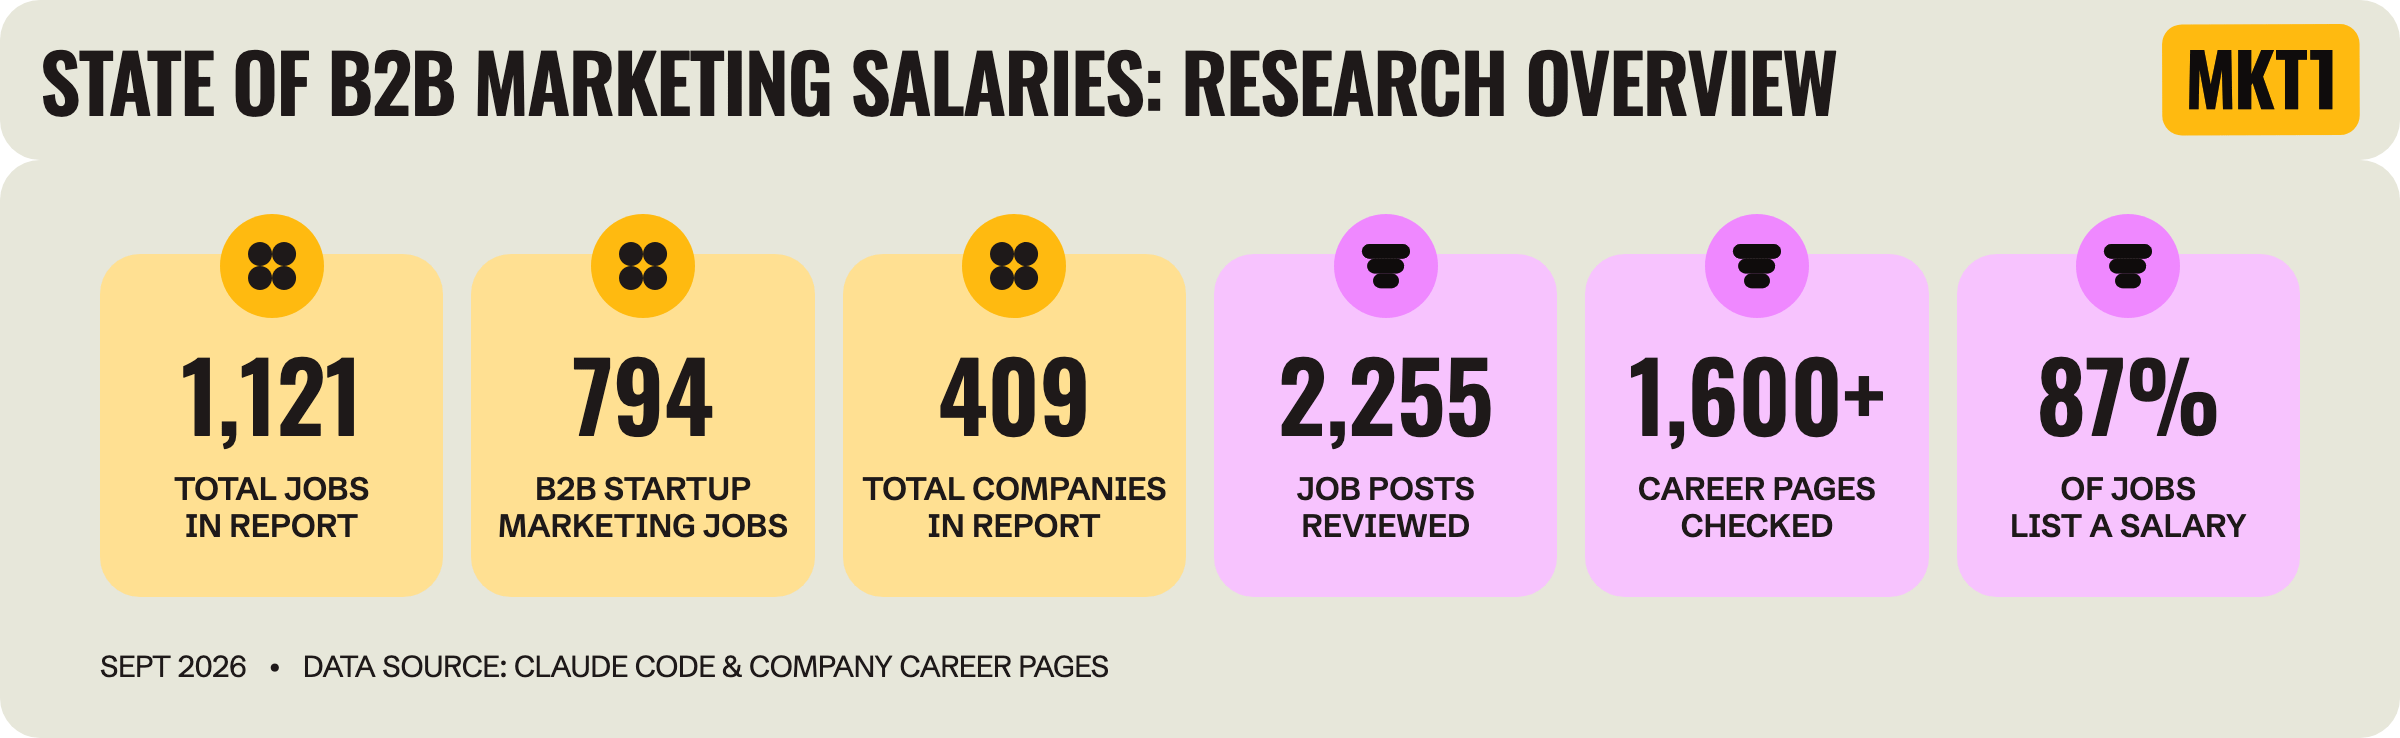
What's in the data: 1,121 US, full-time marketing job posts that list a salary. Most of the report uses the 794 at 347 private B2B startups.
Salary: Most job posts list a salary range, not one number, so I used the midpoint of each range. Example: A job that lists $150K to $190K is $170K in my data. Most graphs show the median of those midpoints, plus the range where the middle half of jobs fall (the 25th to 75th percentile).
Levels: Below Director, I grouped by years of experience, not by title. 0 to 2 years is early career, 3 to 5 is mid and 6+ is senior level. Director and above, I grouped by title.
What's left out of the main graphs: Public companies and OpenAI & Anthropic are only in the graphs that compare them to startups.
Small samples: A blank section in a graph means I couldn't find enough jobs. An asterisk* means a small sample.
Timing: This is a snapshot of jobs open in September 2026. It shows what companies are offering now, not what people in these roles are earning today.
I included more methodology details at the bottom of the newsletter, before the Appendix (which has even more graphs for paid subscribers!).
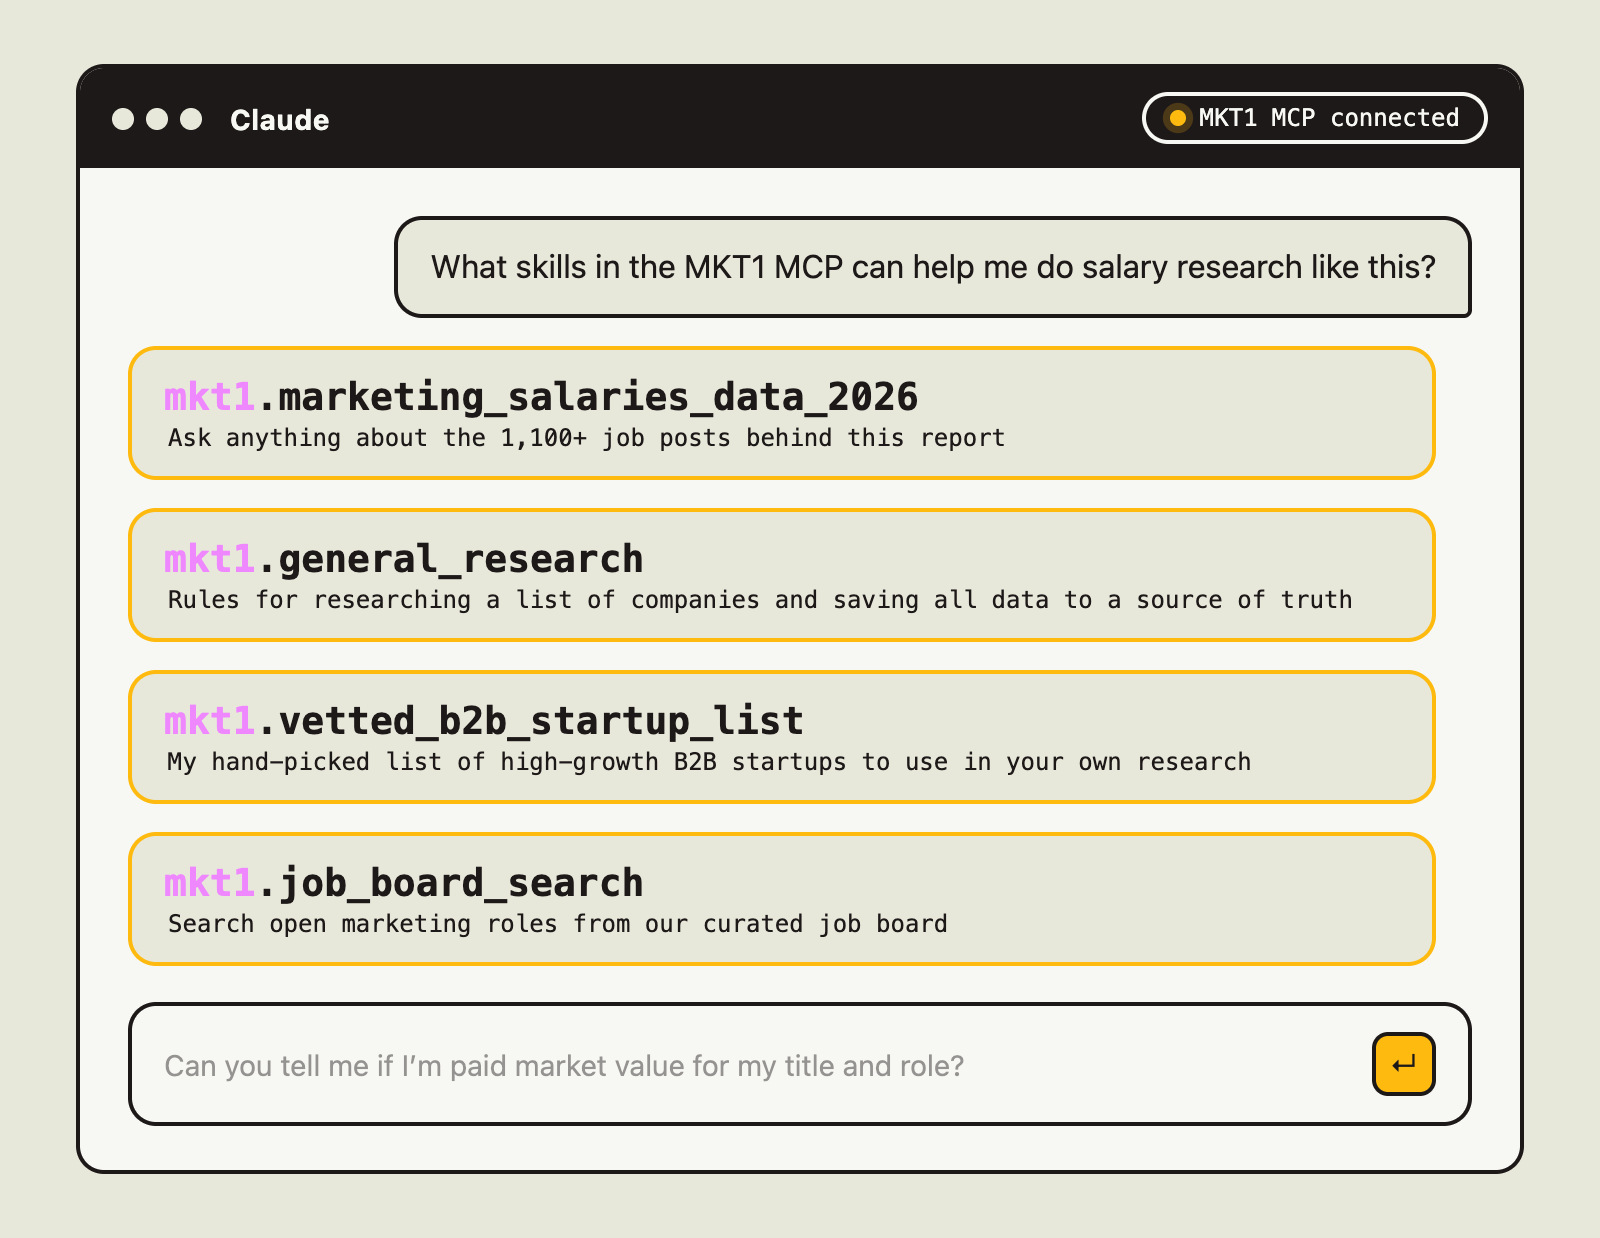
Steal my research skills and data from this report
Everything from the full dataset to the open job listings and the research skills we use at MKT1 are available in the MKT1 MCP for you to use.
Paid subscribers can access all 4 skills, and anyone can search our job board in the MCP for free, which currently includes nearly 500 marketing jobs.
Marketing salary breakdown by area of marketing
This section answers questions like: Which area of marketing pays the most? What does your specific role pay?
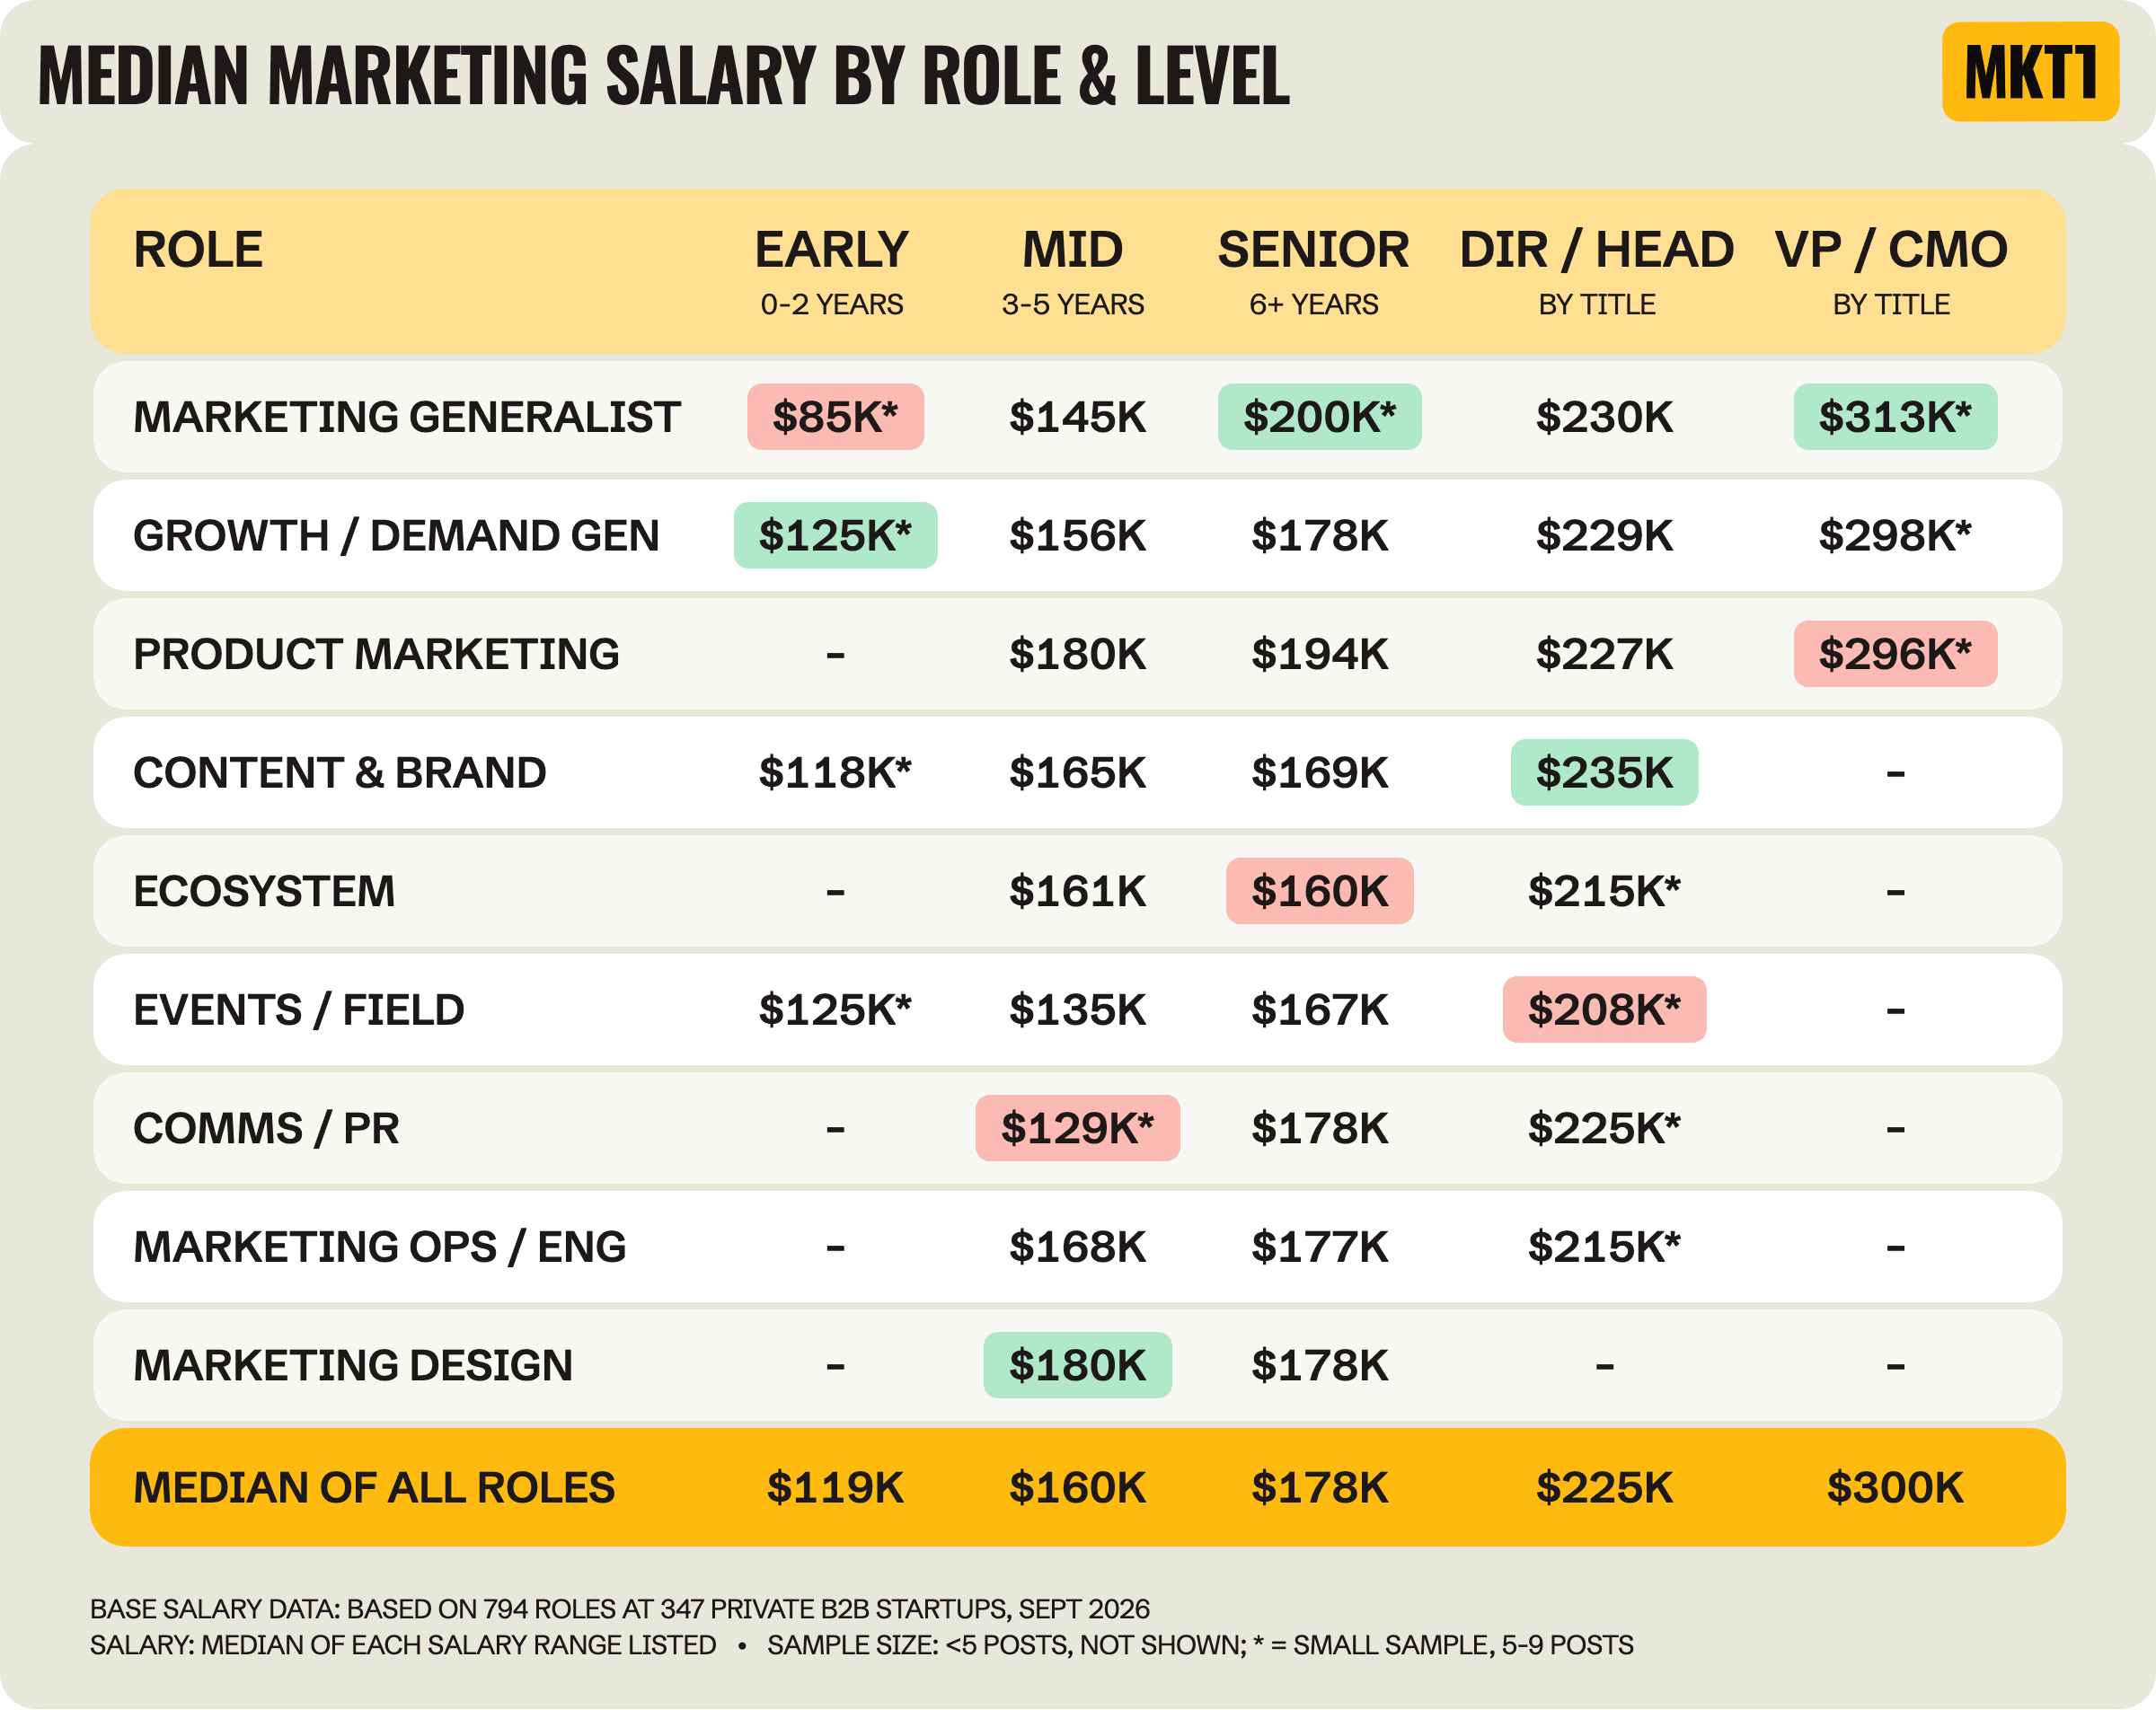
At mid-level, the sub-function you specialize in can mean a $51K difference in salary.
Product marketing pays the most of all sub-functions. Product marketers make a median of $180K at mid-level (tied with marketing design) and $194K at senior level (only generalists make more), vs $160K and $178K for all roles. At Director and VP, product marketers make about the same as everyone else. More in the product marketing section below.
Events and field is the only sub-function that pays below the median at every level from mid-level up: $135K vs $160K at mid-level, $167K vs $178K at senior level, and $208K vs $225K at Director / Head of.
The gap between areas shrinks as you move up. At mid-level, the gap between the highest- and lowest-paid sub-functions is $51K ($180K for product marketing and design vs $129K for comms and PR). By VP, the variation is only $17K ($313K for VPs of Marketing vs $296K for VPs of Product Marketing). So your area of marketing matters most in the middle of your career.
What's the breakdown by level for each marketing sub-function?
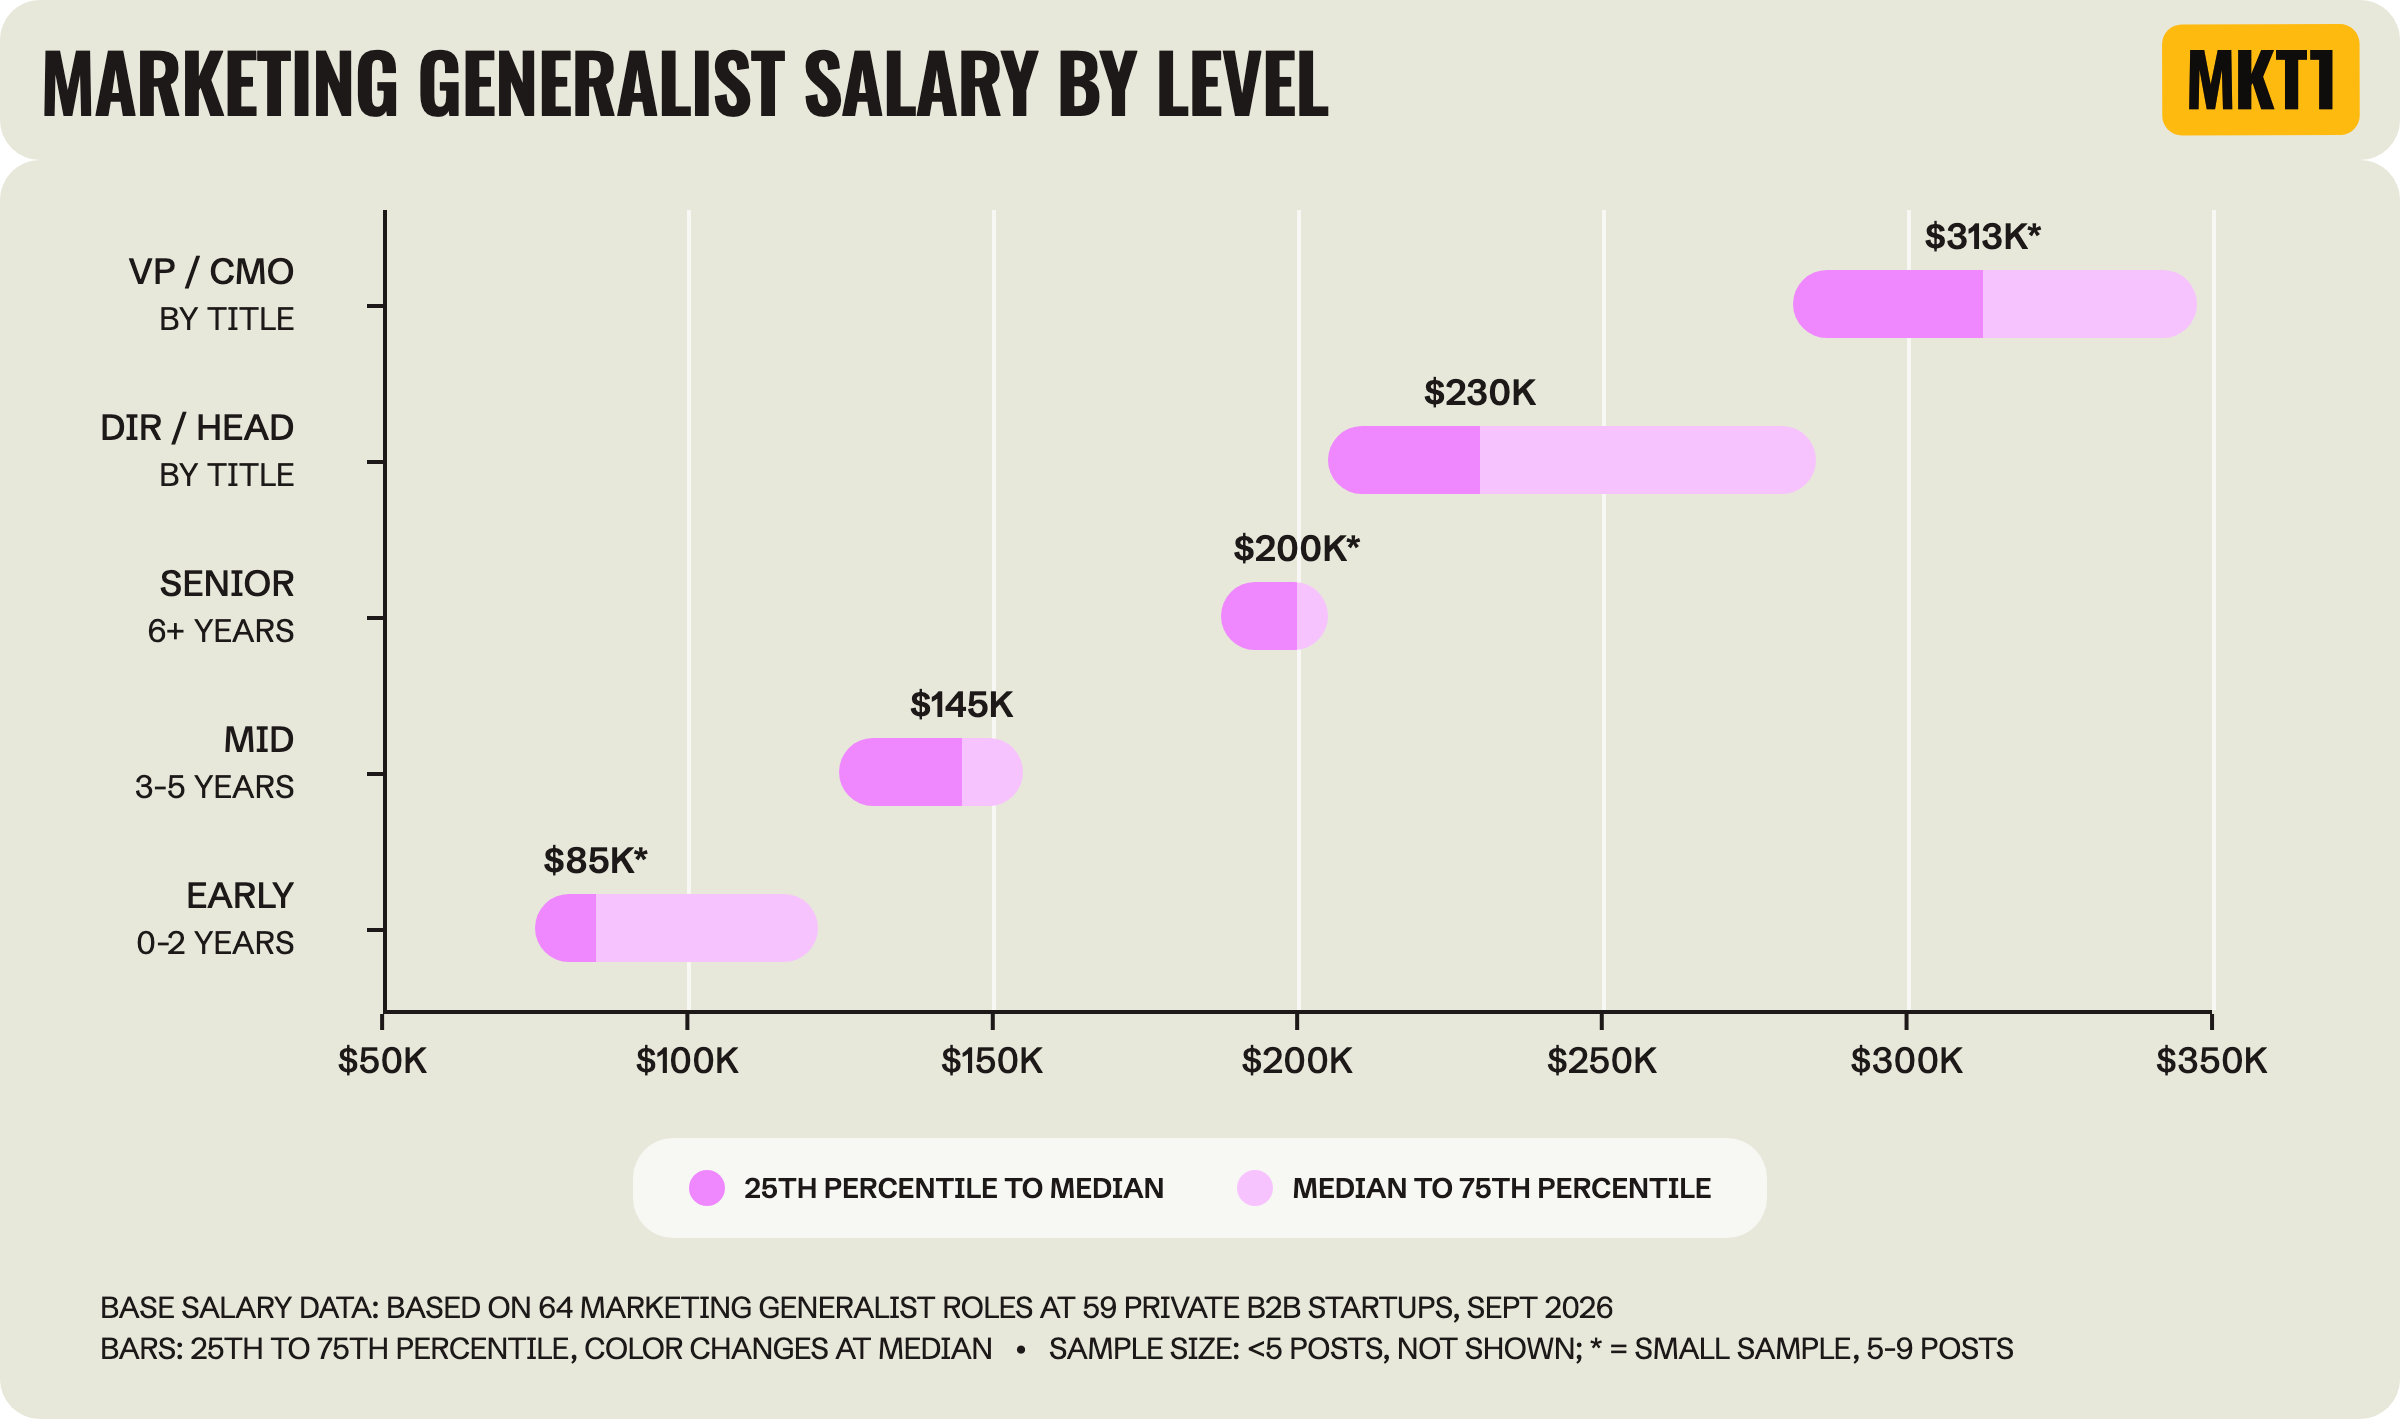
Generalists make the most at senior level and VP / CMO ($200K at senior level and $313K at VP / CMO, the highest of any area) but less than everyone else early on ($85K vs $119K for all roles).
The fact that junior generalists, especially those that are true Gen Marketers, make less doesn’t seem fair to me.
The top-paying jobs in the study list salaries up to $400K or more. They include:
SVP, Influencer Strategy & Marketing at Salesforce ($373K to $465K, should I apply?!)
CMO at EliseAI ($300K to $450K)
Head of Brand at Ramp ($309K to $424K)
Head of Ads Enterprise Marketing at OpenAI ($374K to $415K)
Head of Community, Enterprise Marketing at Anthropic ($400K)
Head of Marketing at DualEntry ($300K to $400K)
The lowest-paying jobs in the study have salaries as low as $50K (these aren’t on the graph because they fall below the 25th percentile). They include a Marketing Associate job in SF ($50K to $70K), an Assistant Marketing Manager job in Ohio ($54K to $90K) and a mid-level Product Marketing Manager job at a public company ($62K to $80K).
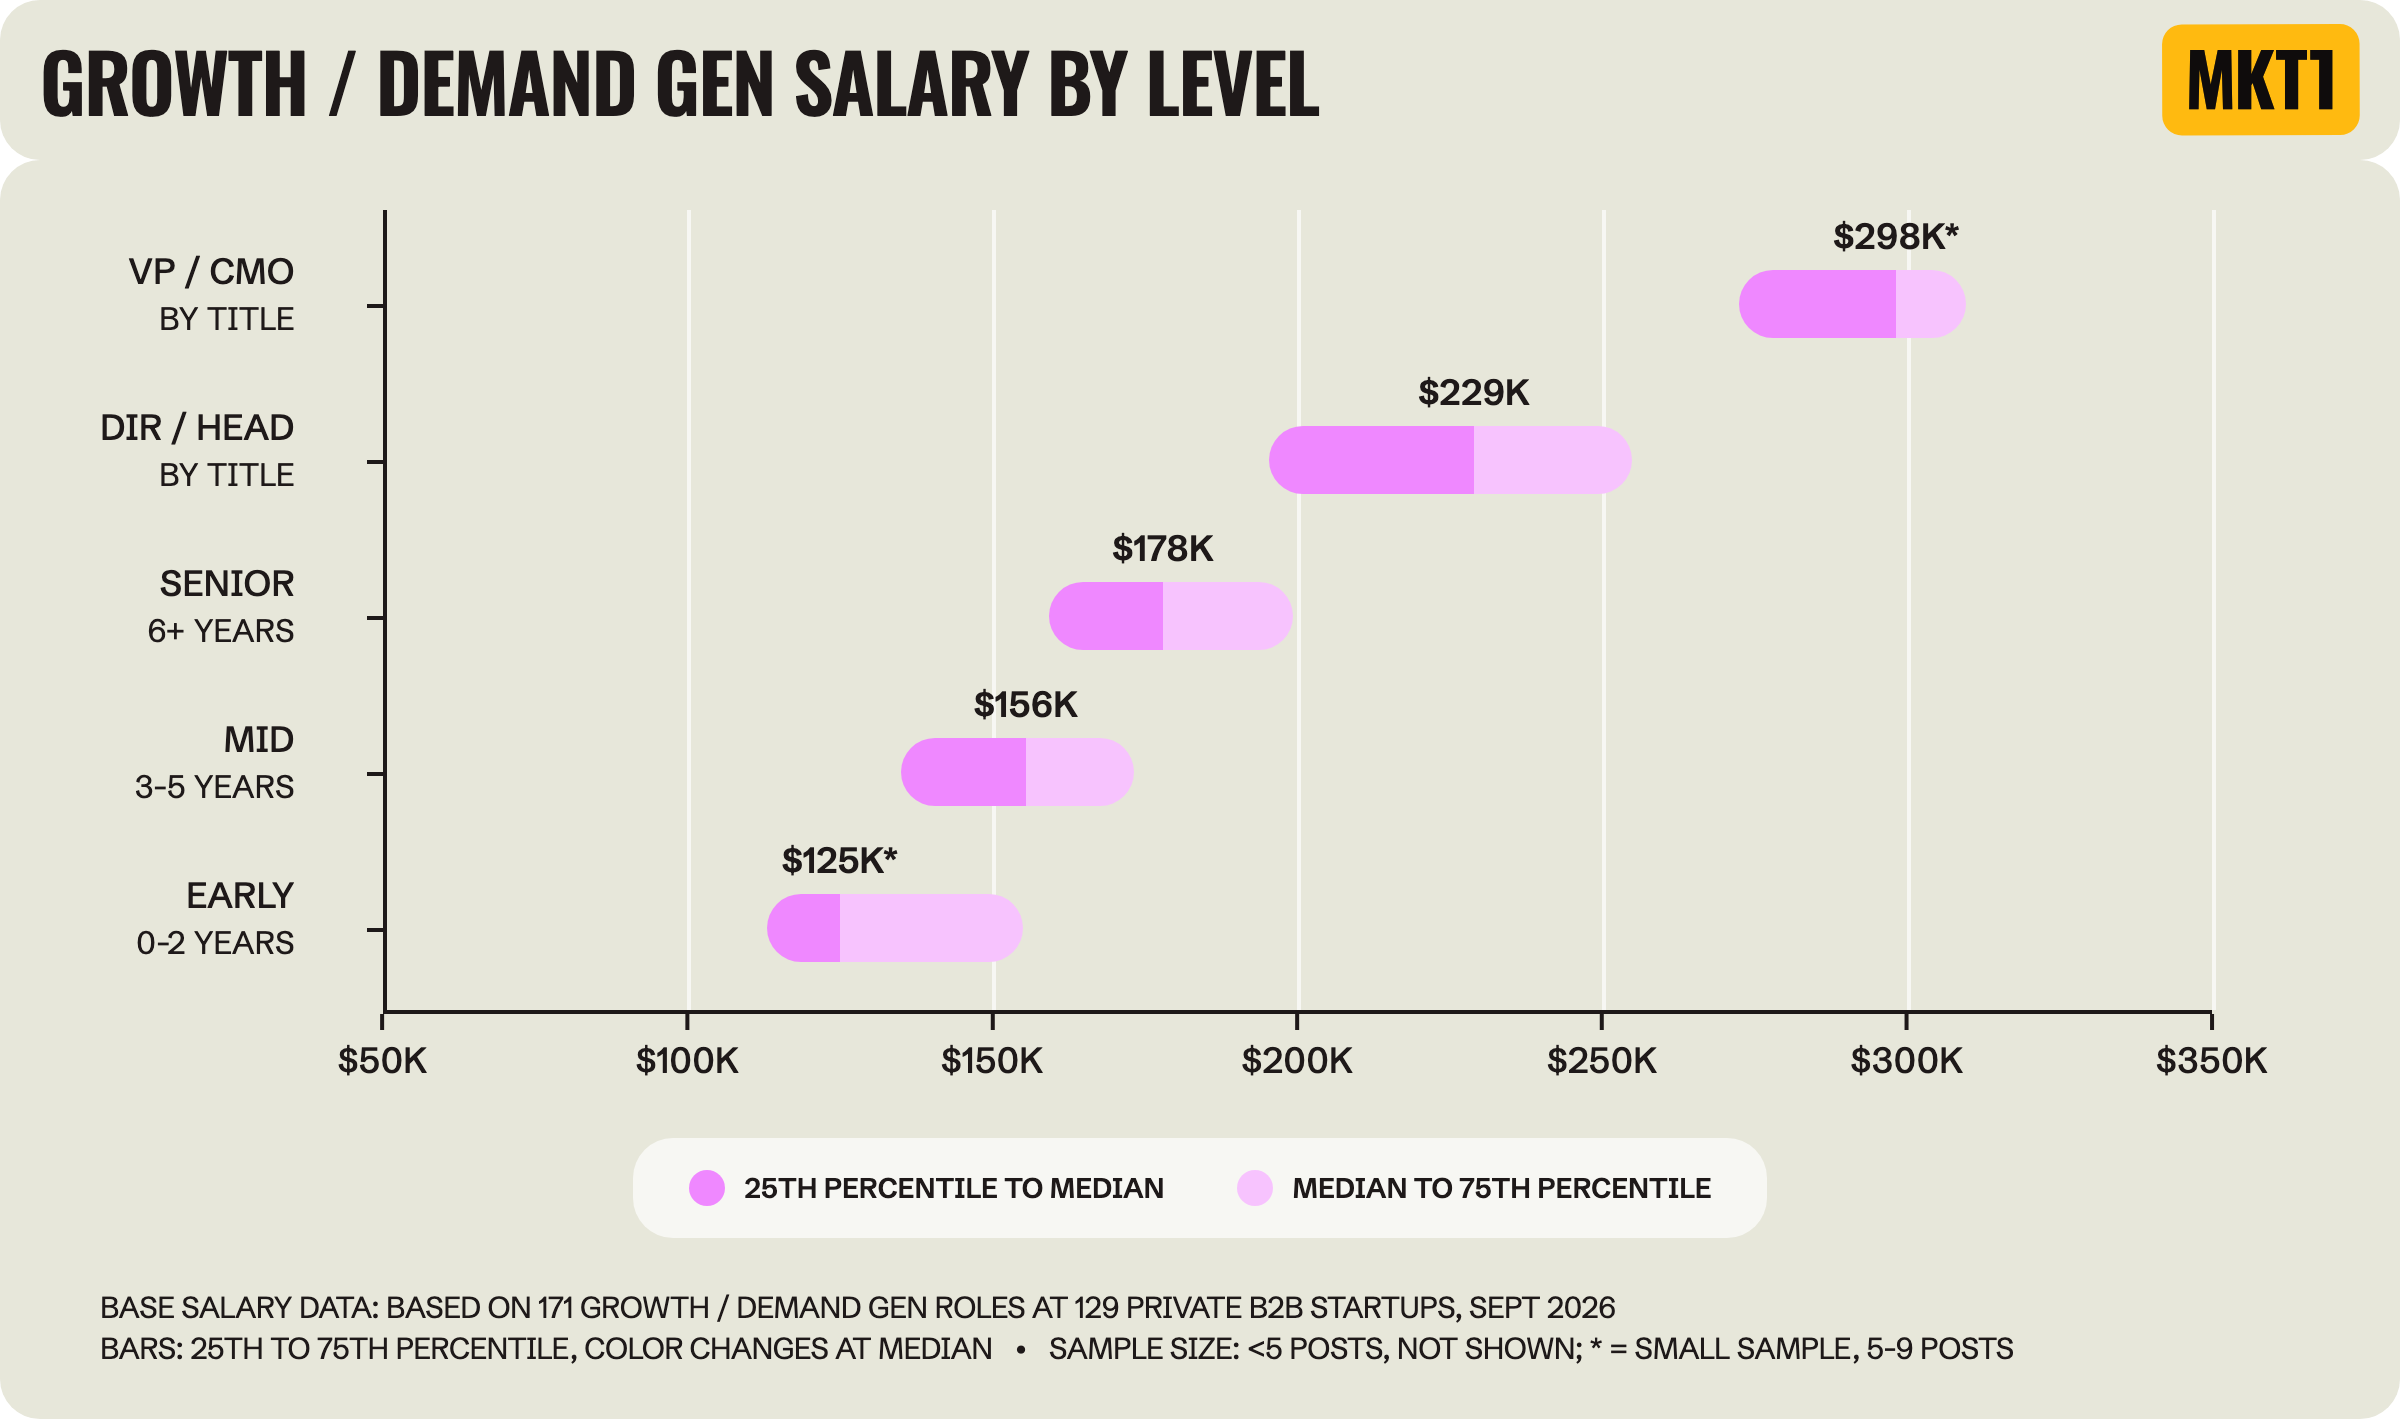
Growth salaries fall right at the overall median at every level. In the past, I often saw growth marketing roles get paid more than other areas of marketing (with the exception of PMM), but that doesn't seem to be the case!
SEO / AEO / web jobs pay the most in growth at some levels, but not all: They're on top at mid-level ($165K, tied with general growth jobs) and at Director ($254K, a small sample). At senior level, paid jobs pay the most ($193K vs $175K for SEO / AEO / web).
Demand gen jobs pay the least at mid-level: $138K vs $165K for general growth. That's likely about who's hiring: Demand gen jobs are less often at AI-native startups or startups that have recently raised. By senior level, the gap goes away ($173K vs $165K). Is this a sign the title is fading in favor of growth overall? I'll look into this more in Part 2.
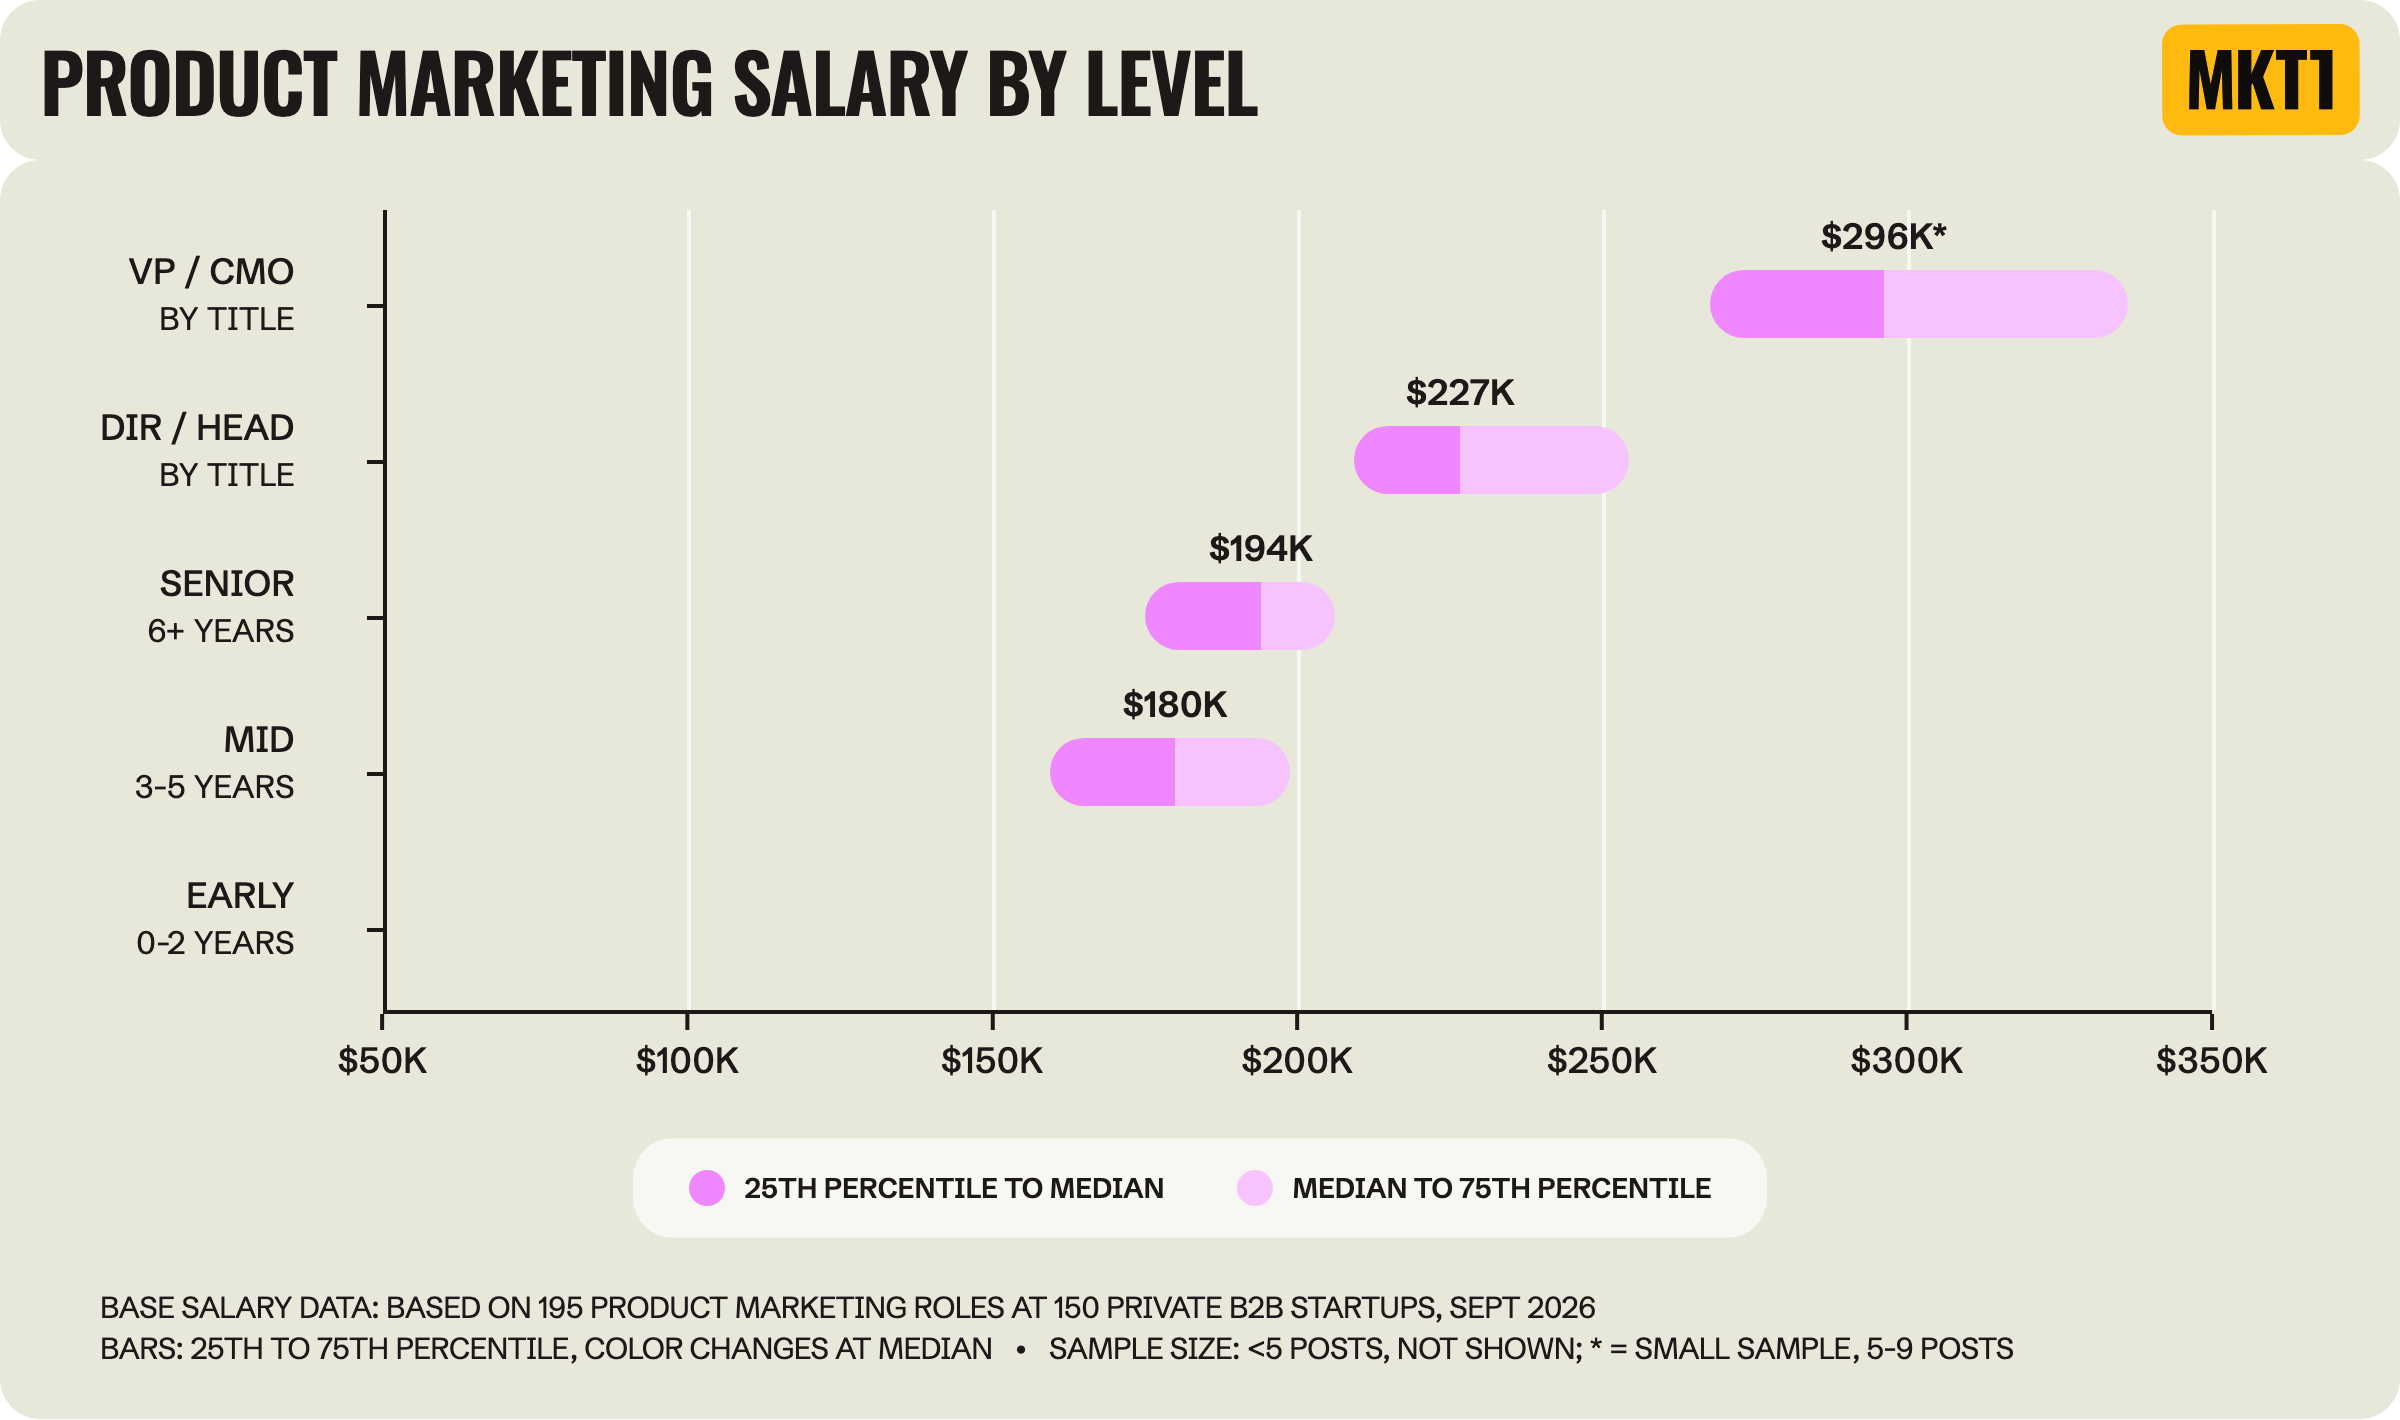
Product Marketing Manager as a job title really tells you nothing about salary. These jobs ask for anywhere from 3 to 8 years of experience, with salaries from $97K to $255K.
Where you work matters more than the title: Product Marketing Manager jobs make a median of $195K in SF vs $161K in NYC and $155K remote, and $190K at AI-native startups vs $158K at other startups.
"Technical" or "developer" in the title doesn't pay more, even though the top mid-level job is a Product Marketing Engineer at ClickHouse at $270K. That's a new title for me...but if you throw engineer on a title, I think that means a salary bump? I should look this up...
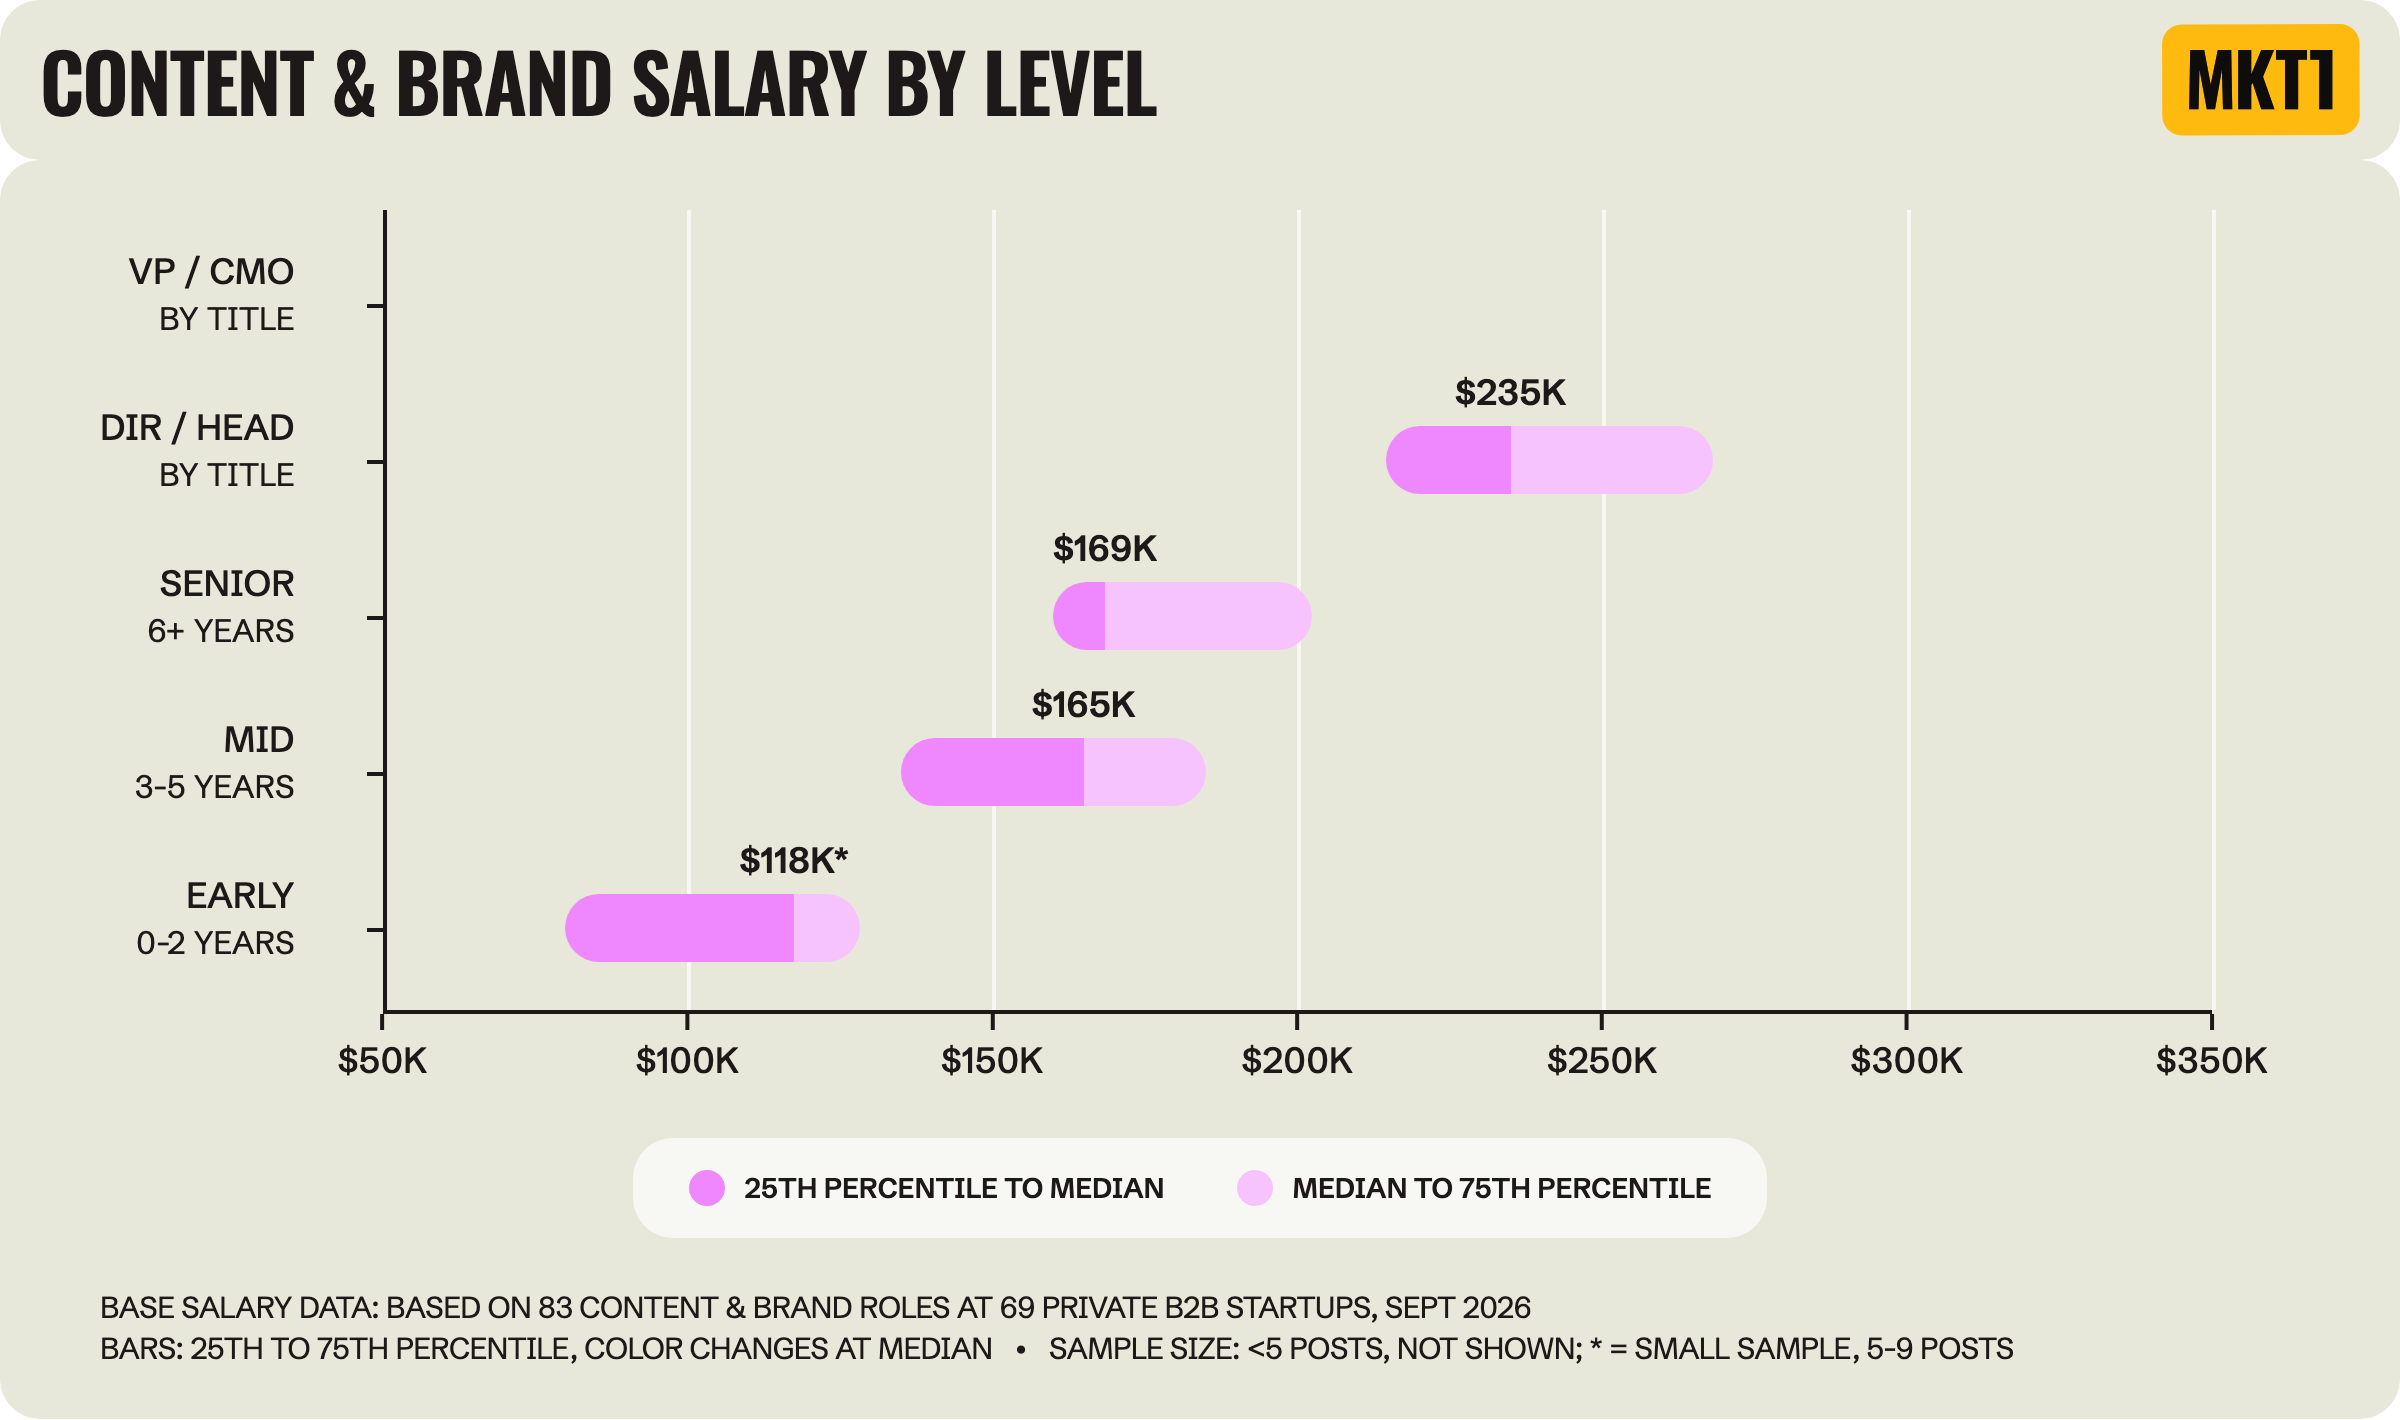
I always thought content and brand got paid less than other areas of marketing, but that doesn't seem to hold up (anymore?). Mid-level content and brand jobs make a median of $165K vs $160K across all roles.
In fact, content and brand leaders make more than the average marketing leader: A median of $235K at Director / Head of vs $225K across all areas.
Video and writing pay the most within content and brand: $185K and $172K at mid-level vs $165K for all content and brand roles.
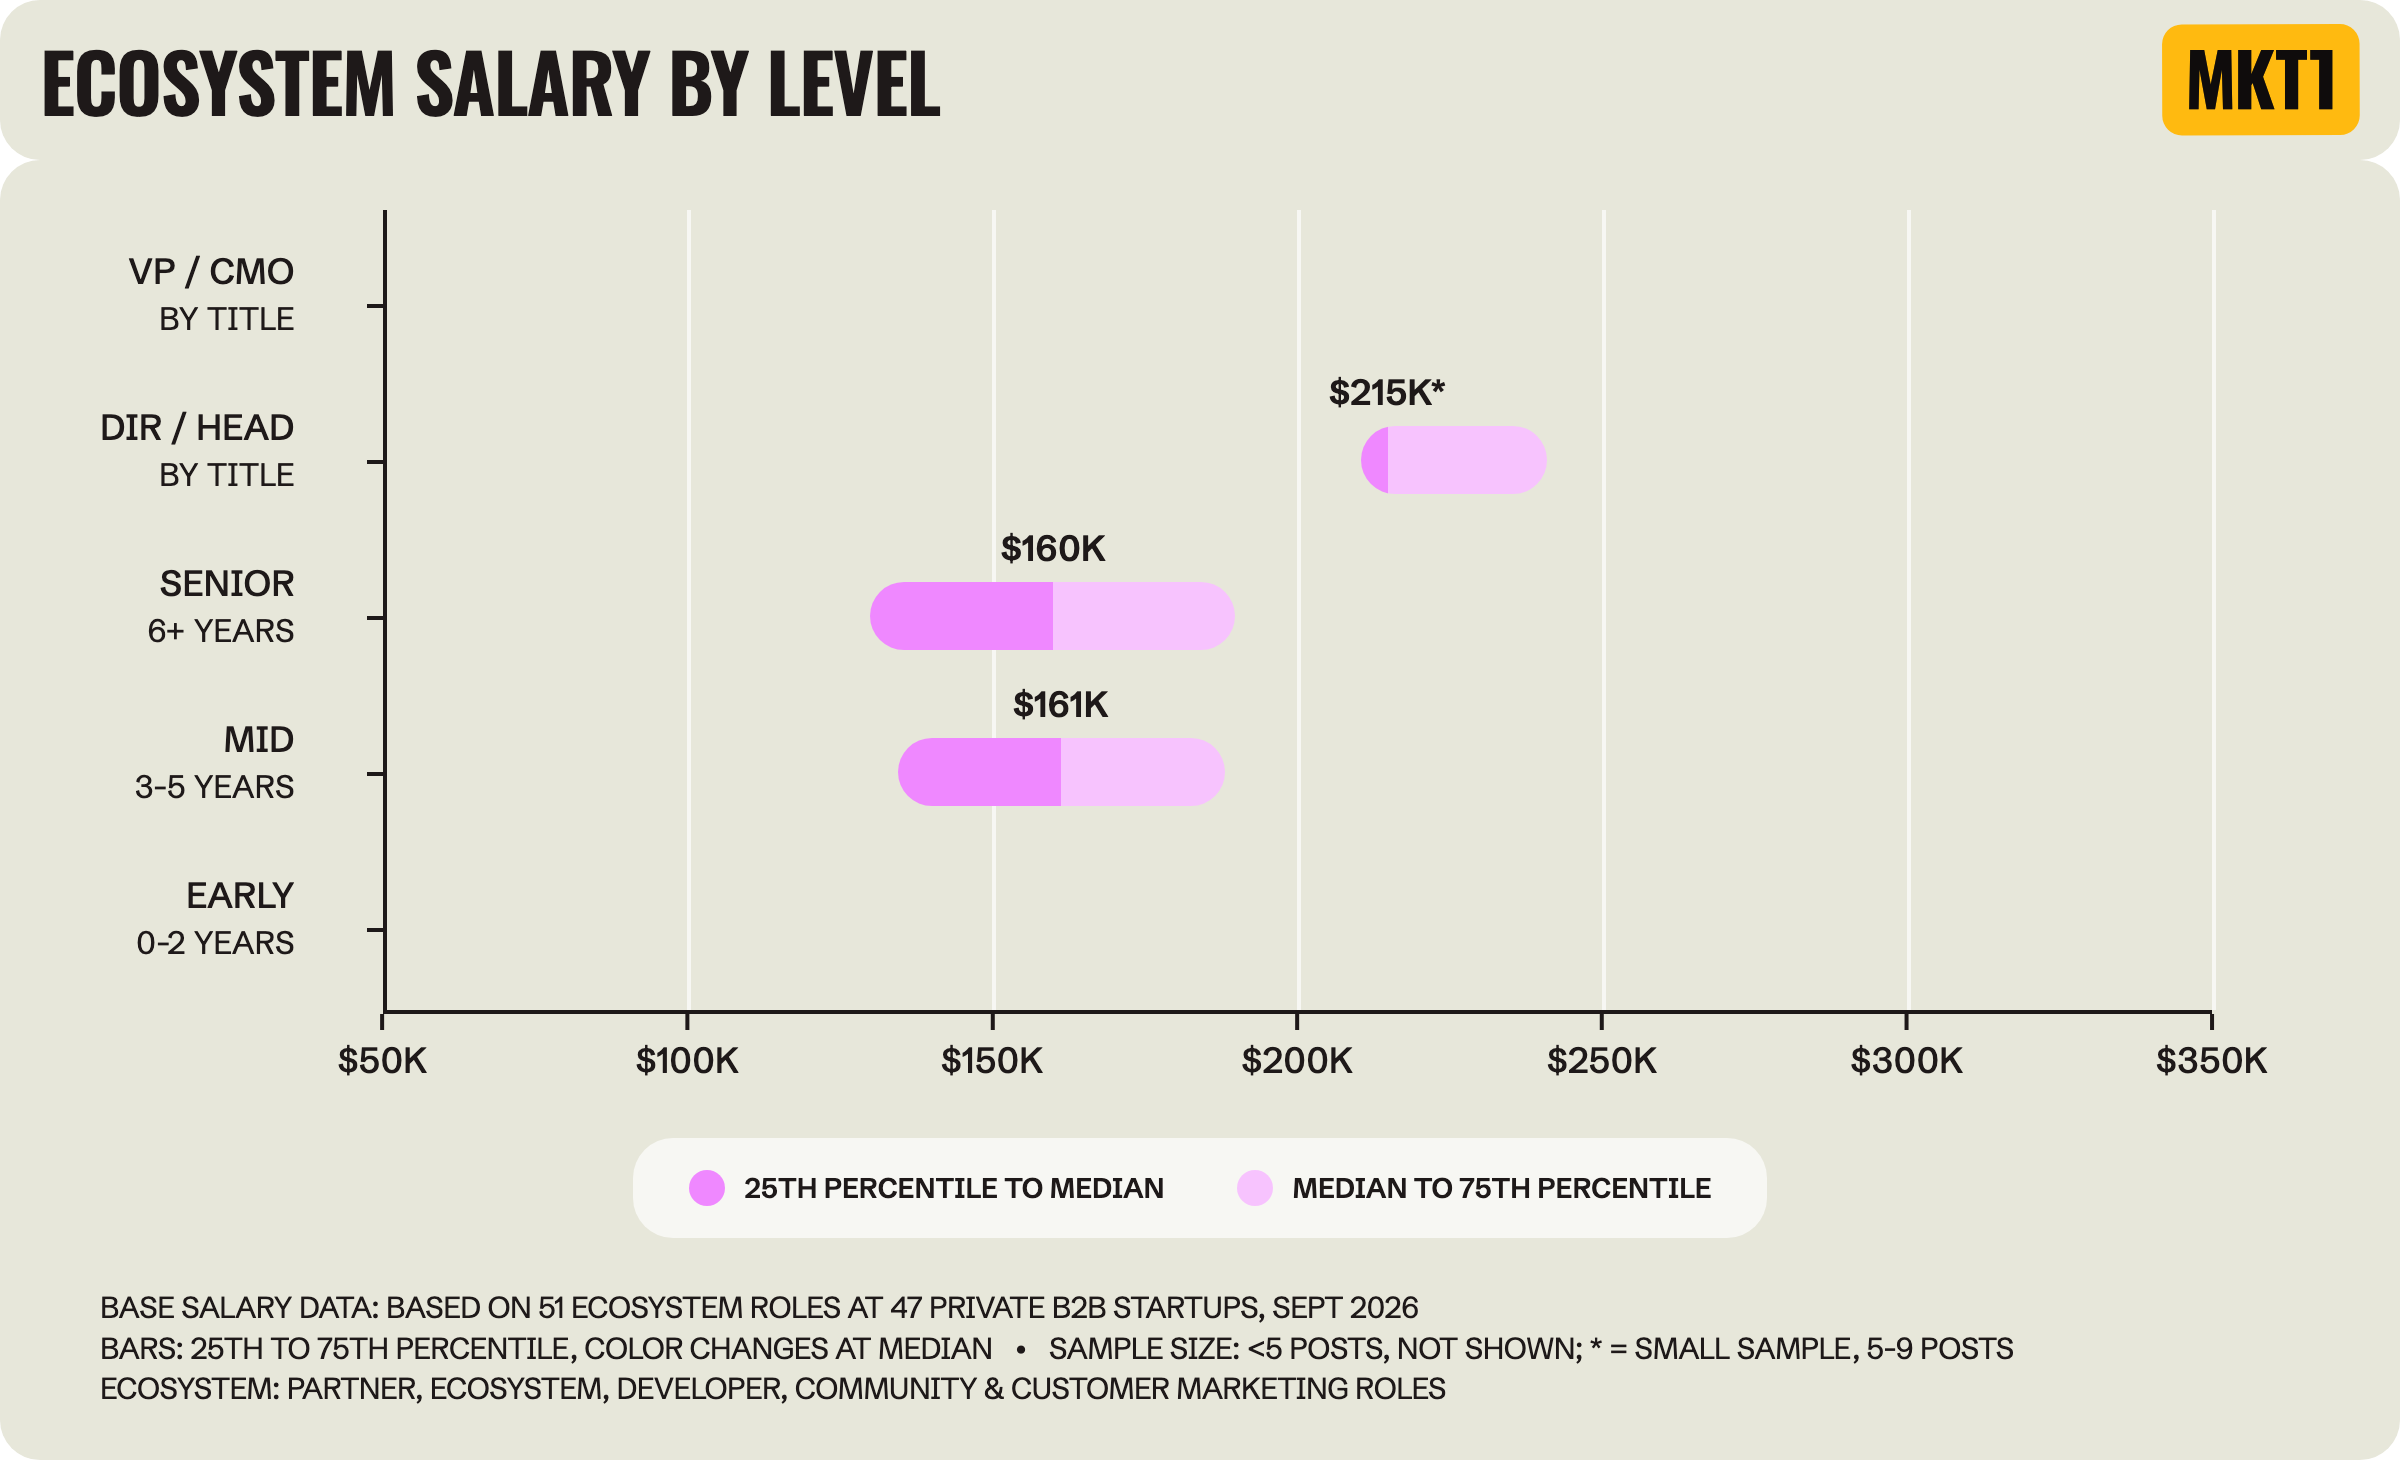
Ecosystem mixes a few different job types and they pay very differently. At the senior level, community and developer roles make a median of $190K, while partner marketing roles make $128K. I also learned that an Alliance Marketer is a thing.
Senior level pays about the same as mid-level ($160K vs $161K) because more of the mid-level jobs are at AI-native startups in SF, like Together.ai, Stuut and Exa, which pay more.
For ecosystem roles, extra years of experience at mid and senior levels don’t impact salary much. The big raise comes with the Director / Head of title ($215K).
Note: The sample here is small, and some of these ecosystem responsibilities fall into other roles like PMM, so take it with a grain of salt.
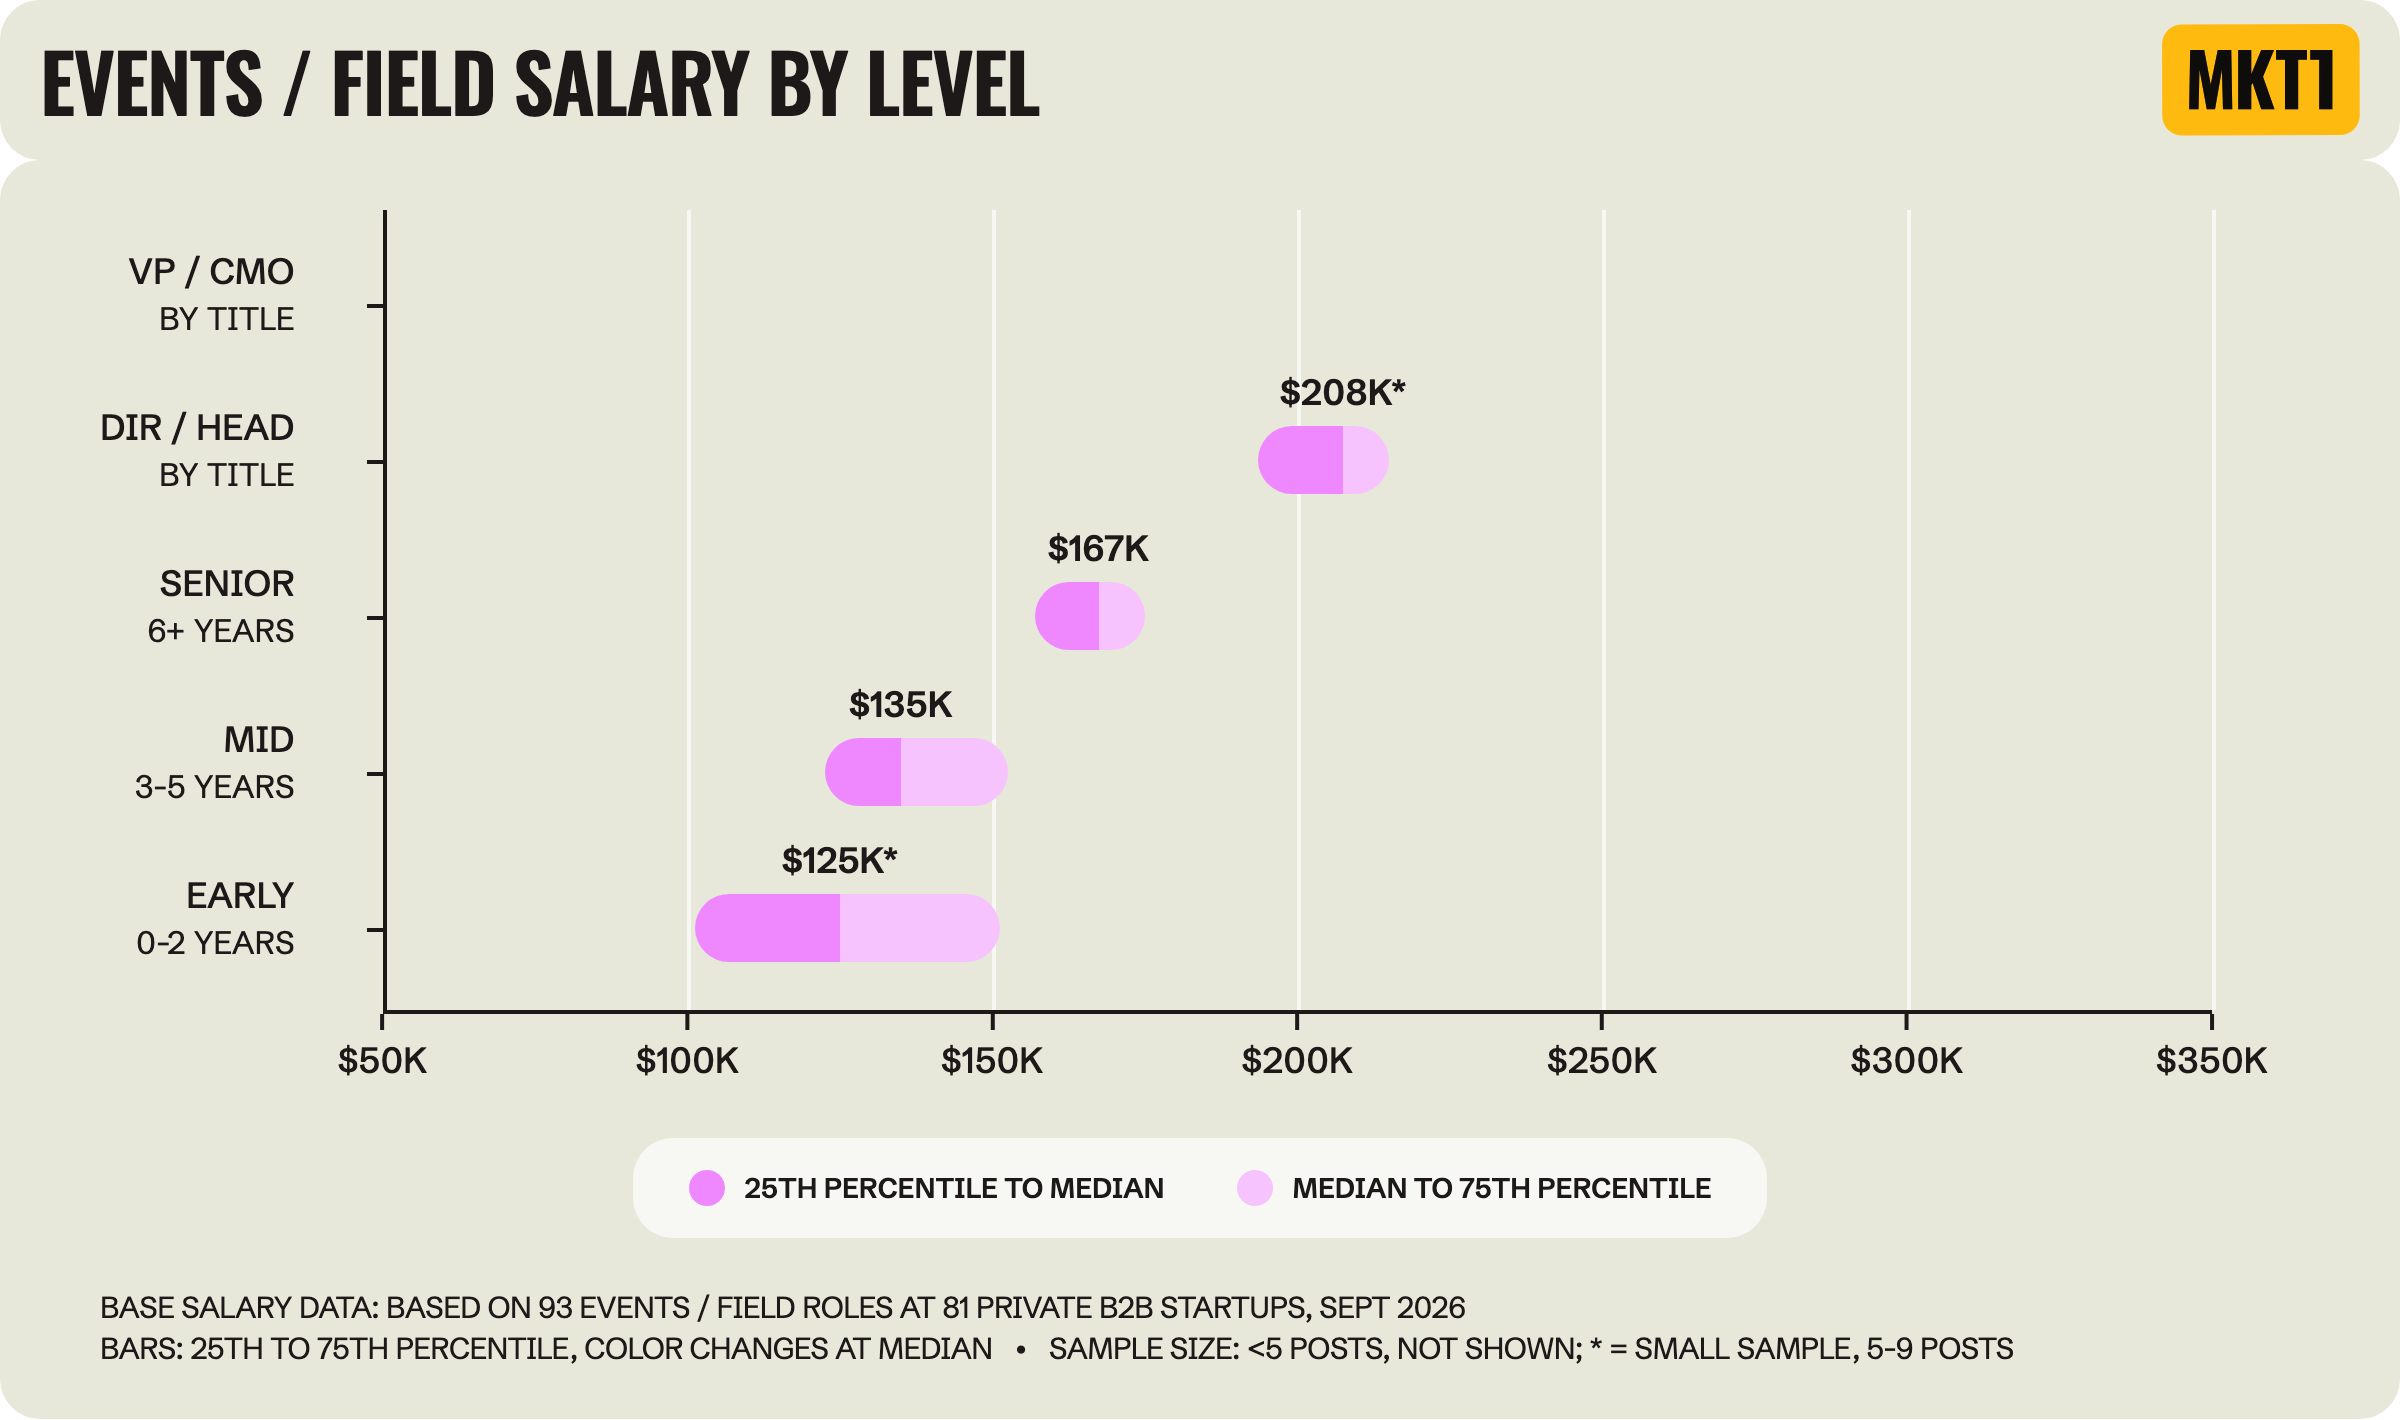
Events and field marketing is one of the few areas with early-career jobs available, with a $125K median for 0 to 2 years of experience.
Field marketing roles pay more than event marketing roles: At mid-level, field marketing jobs make a median of $142K vs $128K for event marketing jobs, likely because field roles are tied to sales pipeline.
This might explain why the mid-level range is so huge: From $79K for a remote Event Marketing Manager at Boulevard to $215K for a Senior Field Marketing Manager at Opal Security in SF.
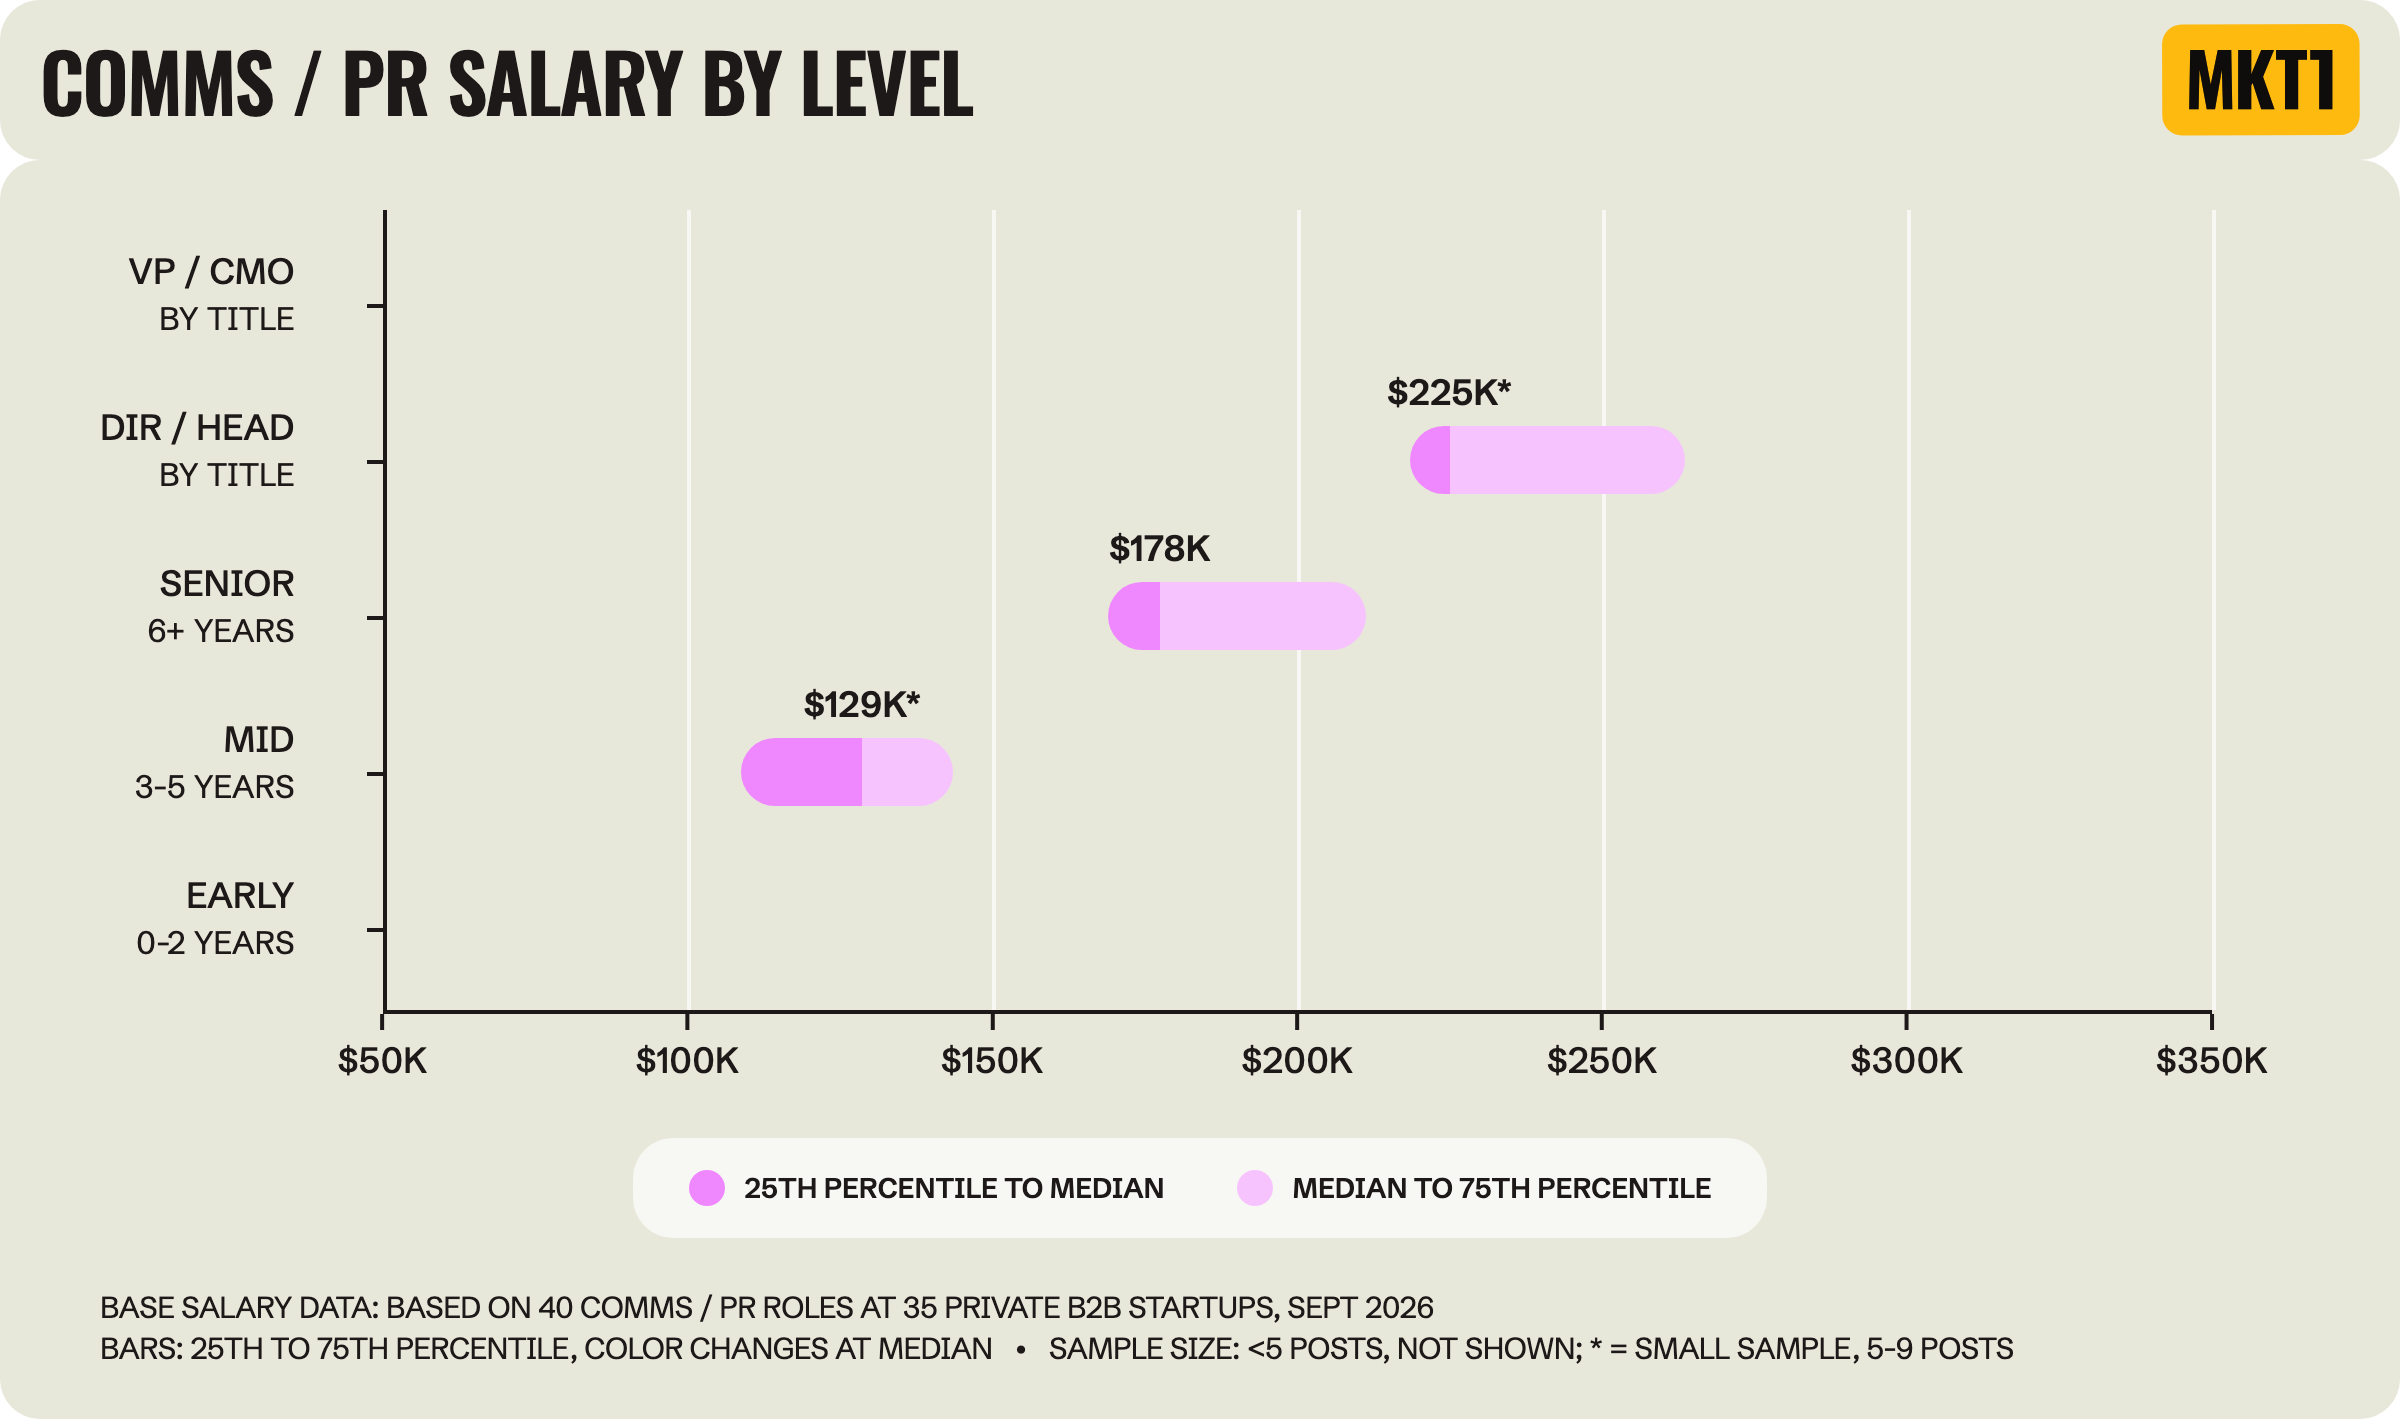
Comms and PR pays less than most areas at mid-level, but matches the average by senior level.
Senior comms and PR marketers make a median of $178K vs $129K at mid-level, a $49K or 38% increase (a small sample at mid-level). At Director / Head of, it's $225K (also a small sample).
There were only 40 comms and PR jobs in the study, and 25 of them were at AI-native startups.
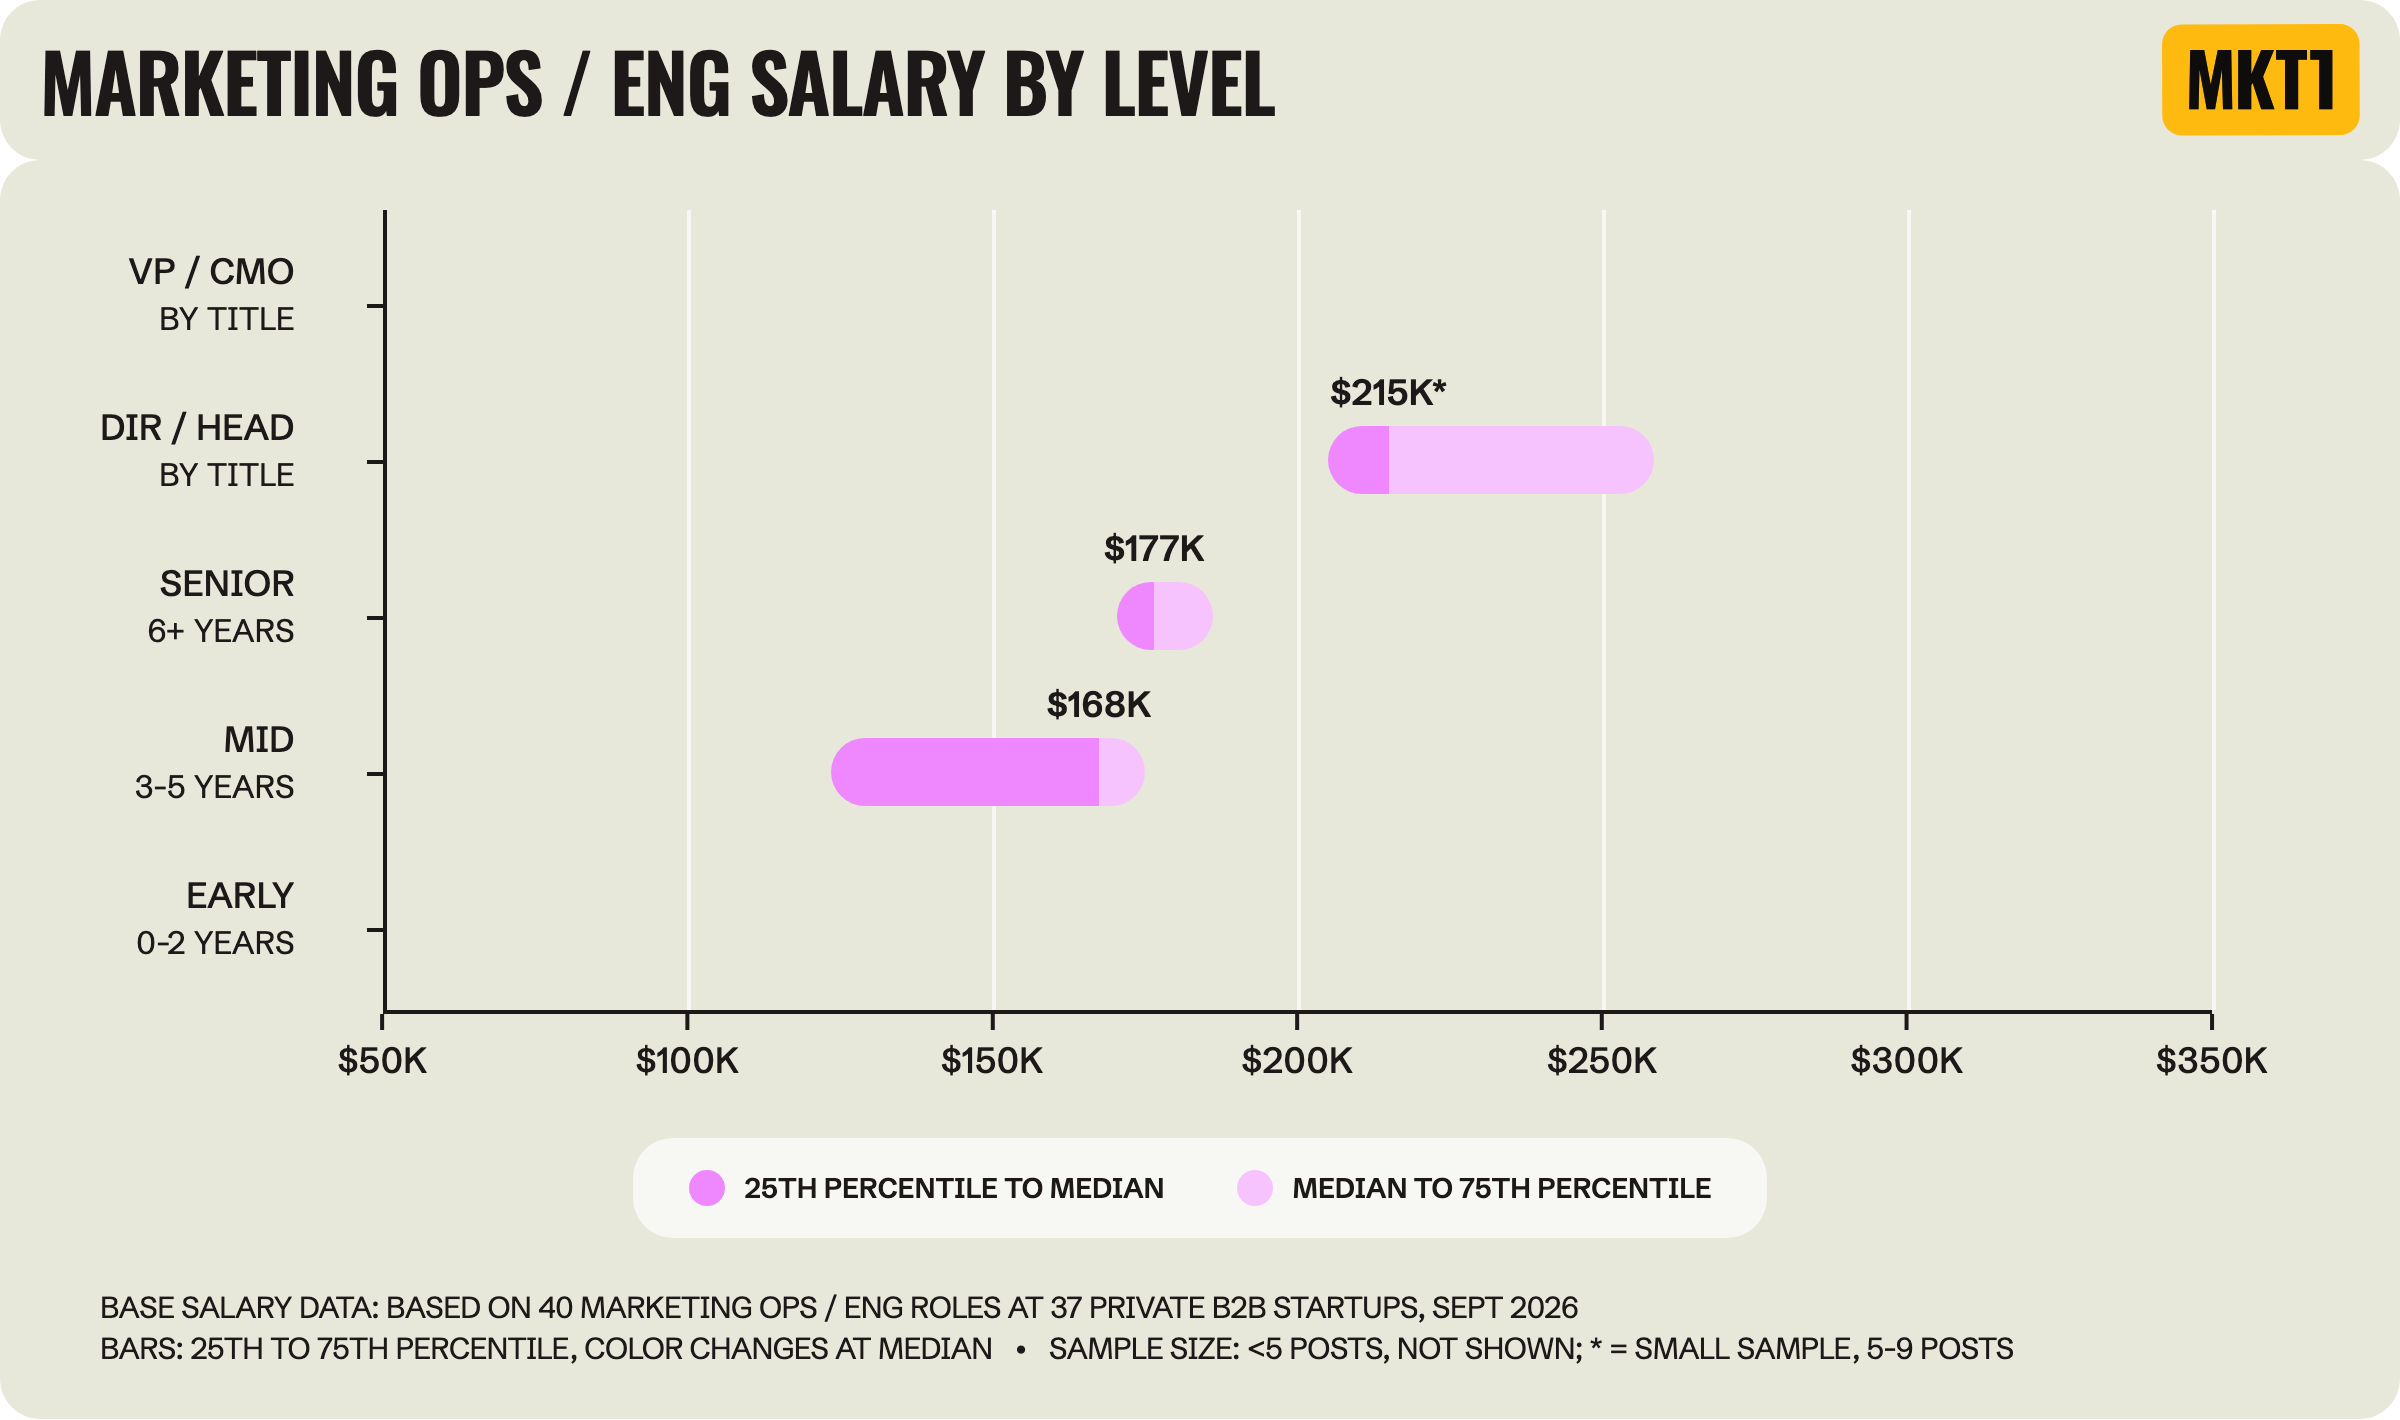
Marketing ops and marketing engineering are blurring together, and the marketing ops function is often merged with RevOps (or GTM engineering) overall. Meaning, this is a tough area to analyze for marketing alone, but I still tried?
Marketing engineers make a lot more than marketing ops managers: $195K vs $140K at mid-level*.
Marketing engineer is a newer title, with only 6 job posts so far, but it already pays $55K more. Remains to be seen how different these skillsets actually are. Most of these jobs are at AI-native startups, which usually means a higher salary, but even there, marketing engineers make about $40K more than marketing ops managers.
🐷 Go ham with the data! It’s all in the MKT1 MCP
All the salary data behind this report, including 1,100+ job posts, is available for paid subscribers. Install the MCP and use the Marketing Salaries Data 2026 skill.
You can slice and dice the data, make your own graphs (I used Claude Design, built off Figma Graph templates I made for the State of Marketing report for mine), or ask the skill for direct links to the jobs (as long as they're still live).
Marketing salary breakdown by company details
This section answers questions like: How much does location change salary? Do OpenAI & Anthropic and AI-native startups really pay more? Do recently funded startups pay more?
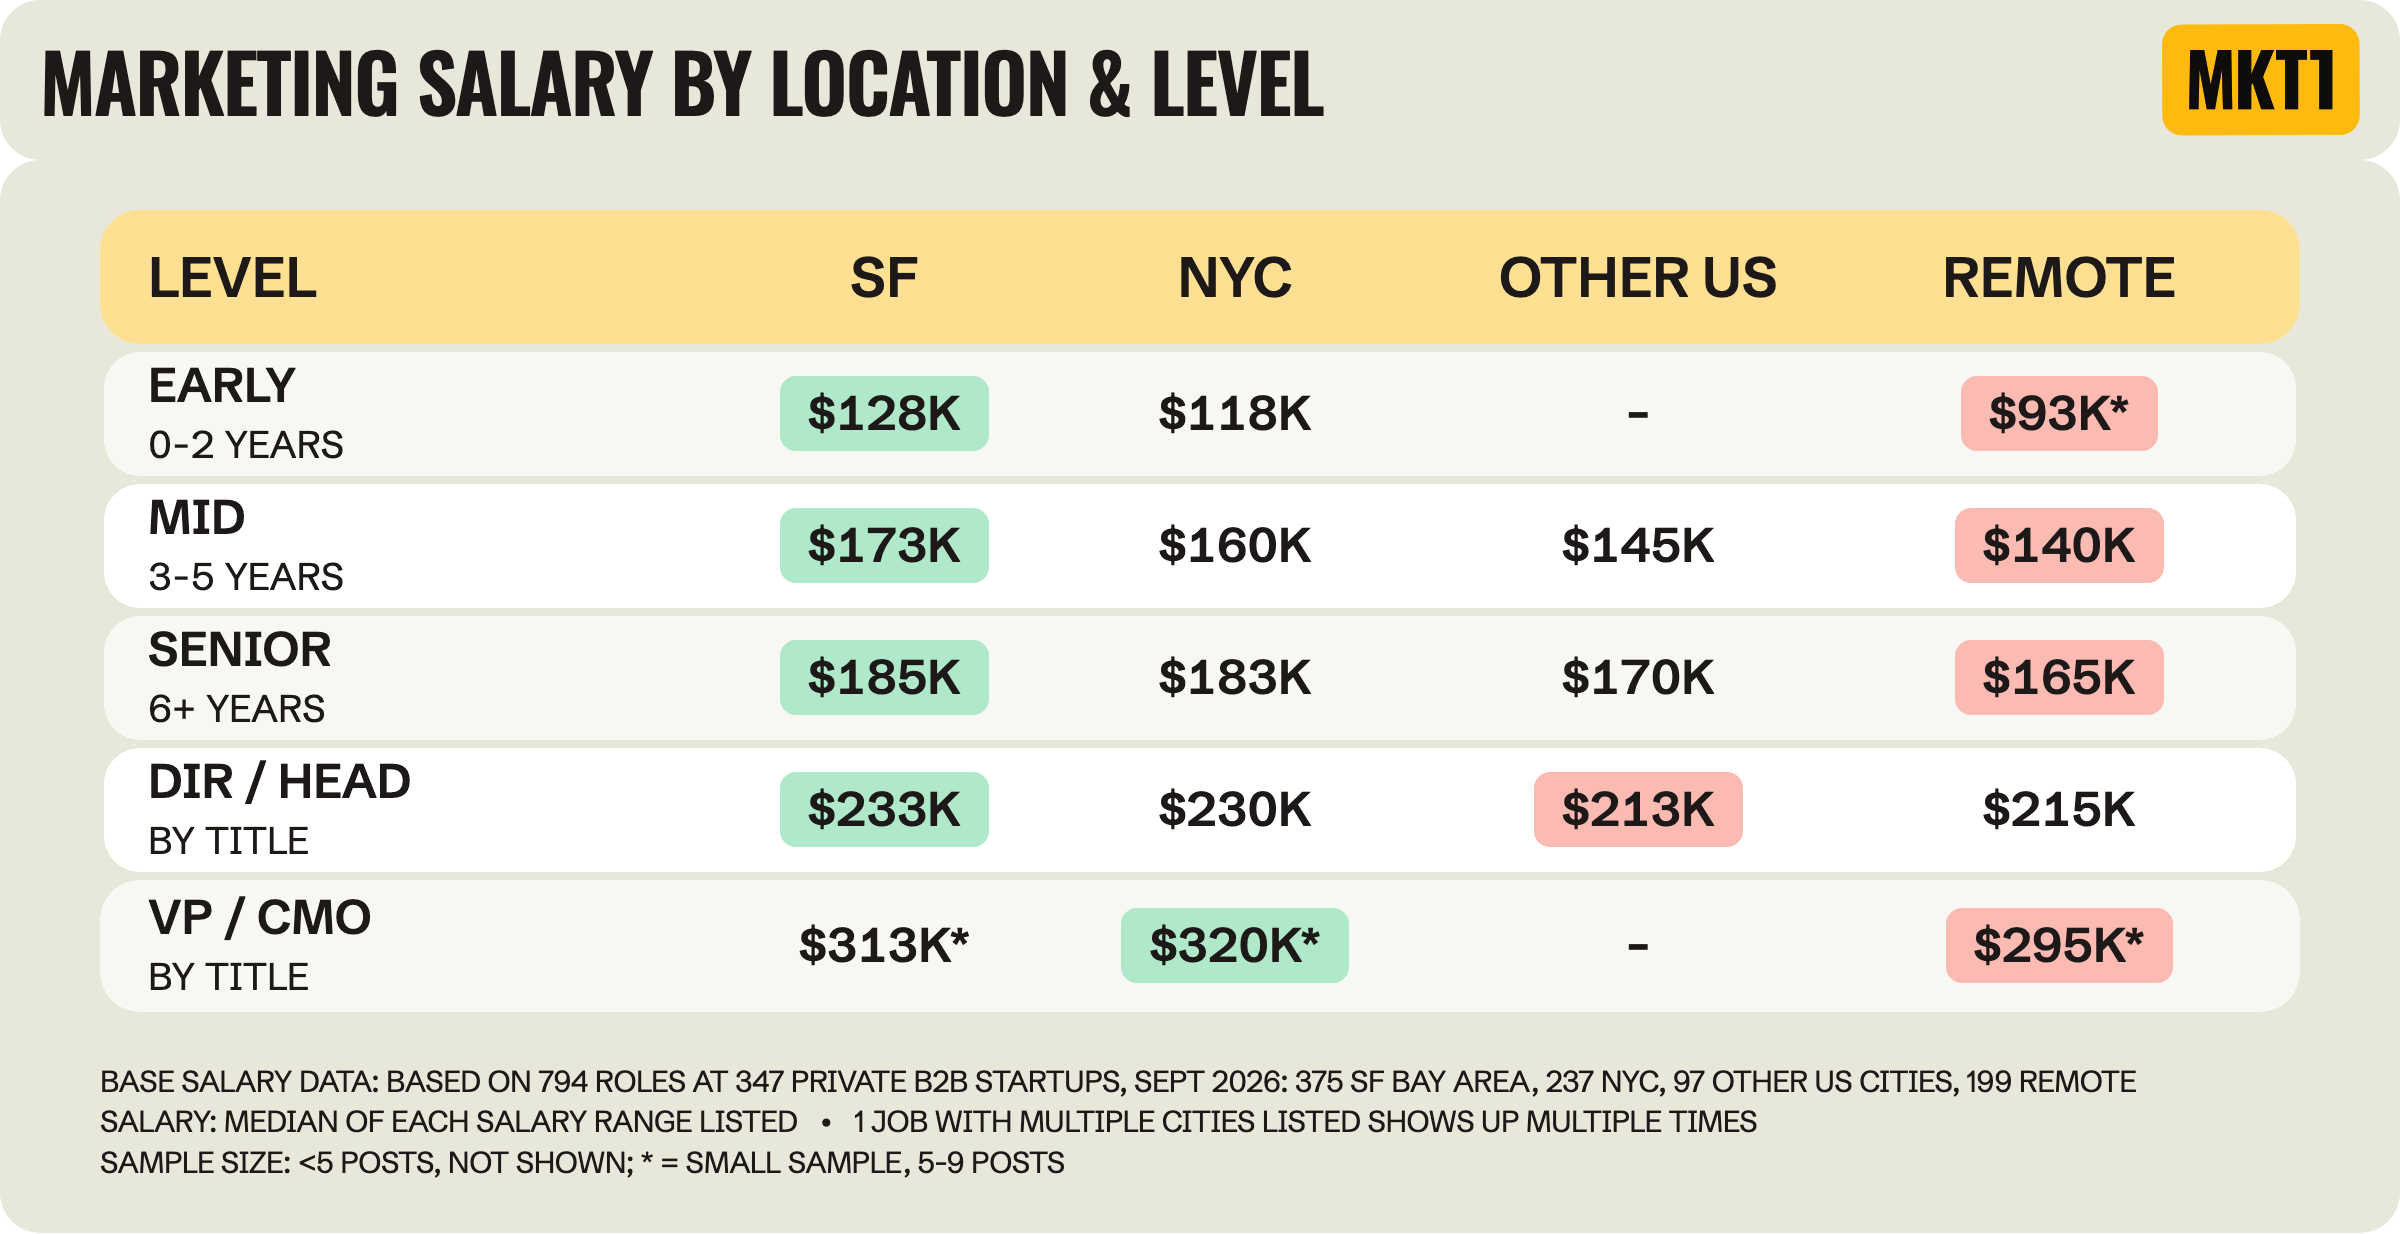
Remote jobs pay the least at early career, mid and senior level. At Director / Head of, they pay about the same as jobs in other US cities ($215K vs $213K), but less than in SF and NYC.
SF pays more than NYC at mid-level ($173K vs $160K), but they're nearly tied from senior level up.
If you're not in SF or NYC, expect about 10 to 15% less for the same job. Companies seem to be (finally) using the same cost of living adjustments: When they post one job with a different range for each city, the second city is almost always 10% less and the third about 15% less. A few, like Glean and Legora, list the same range in all cities where they have jobs.
What company attributes impact salary most?
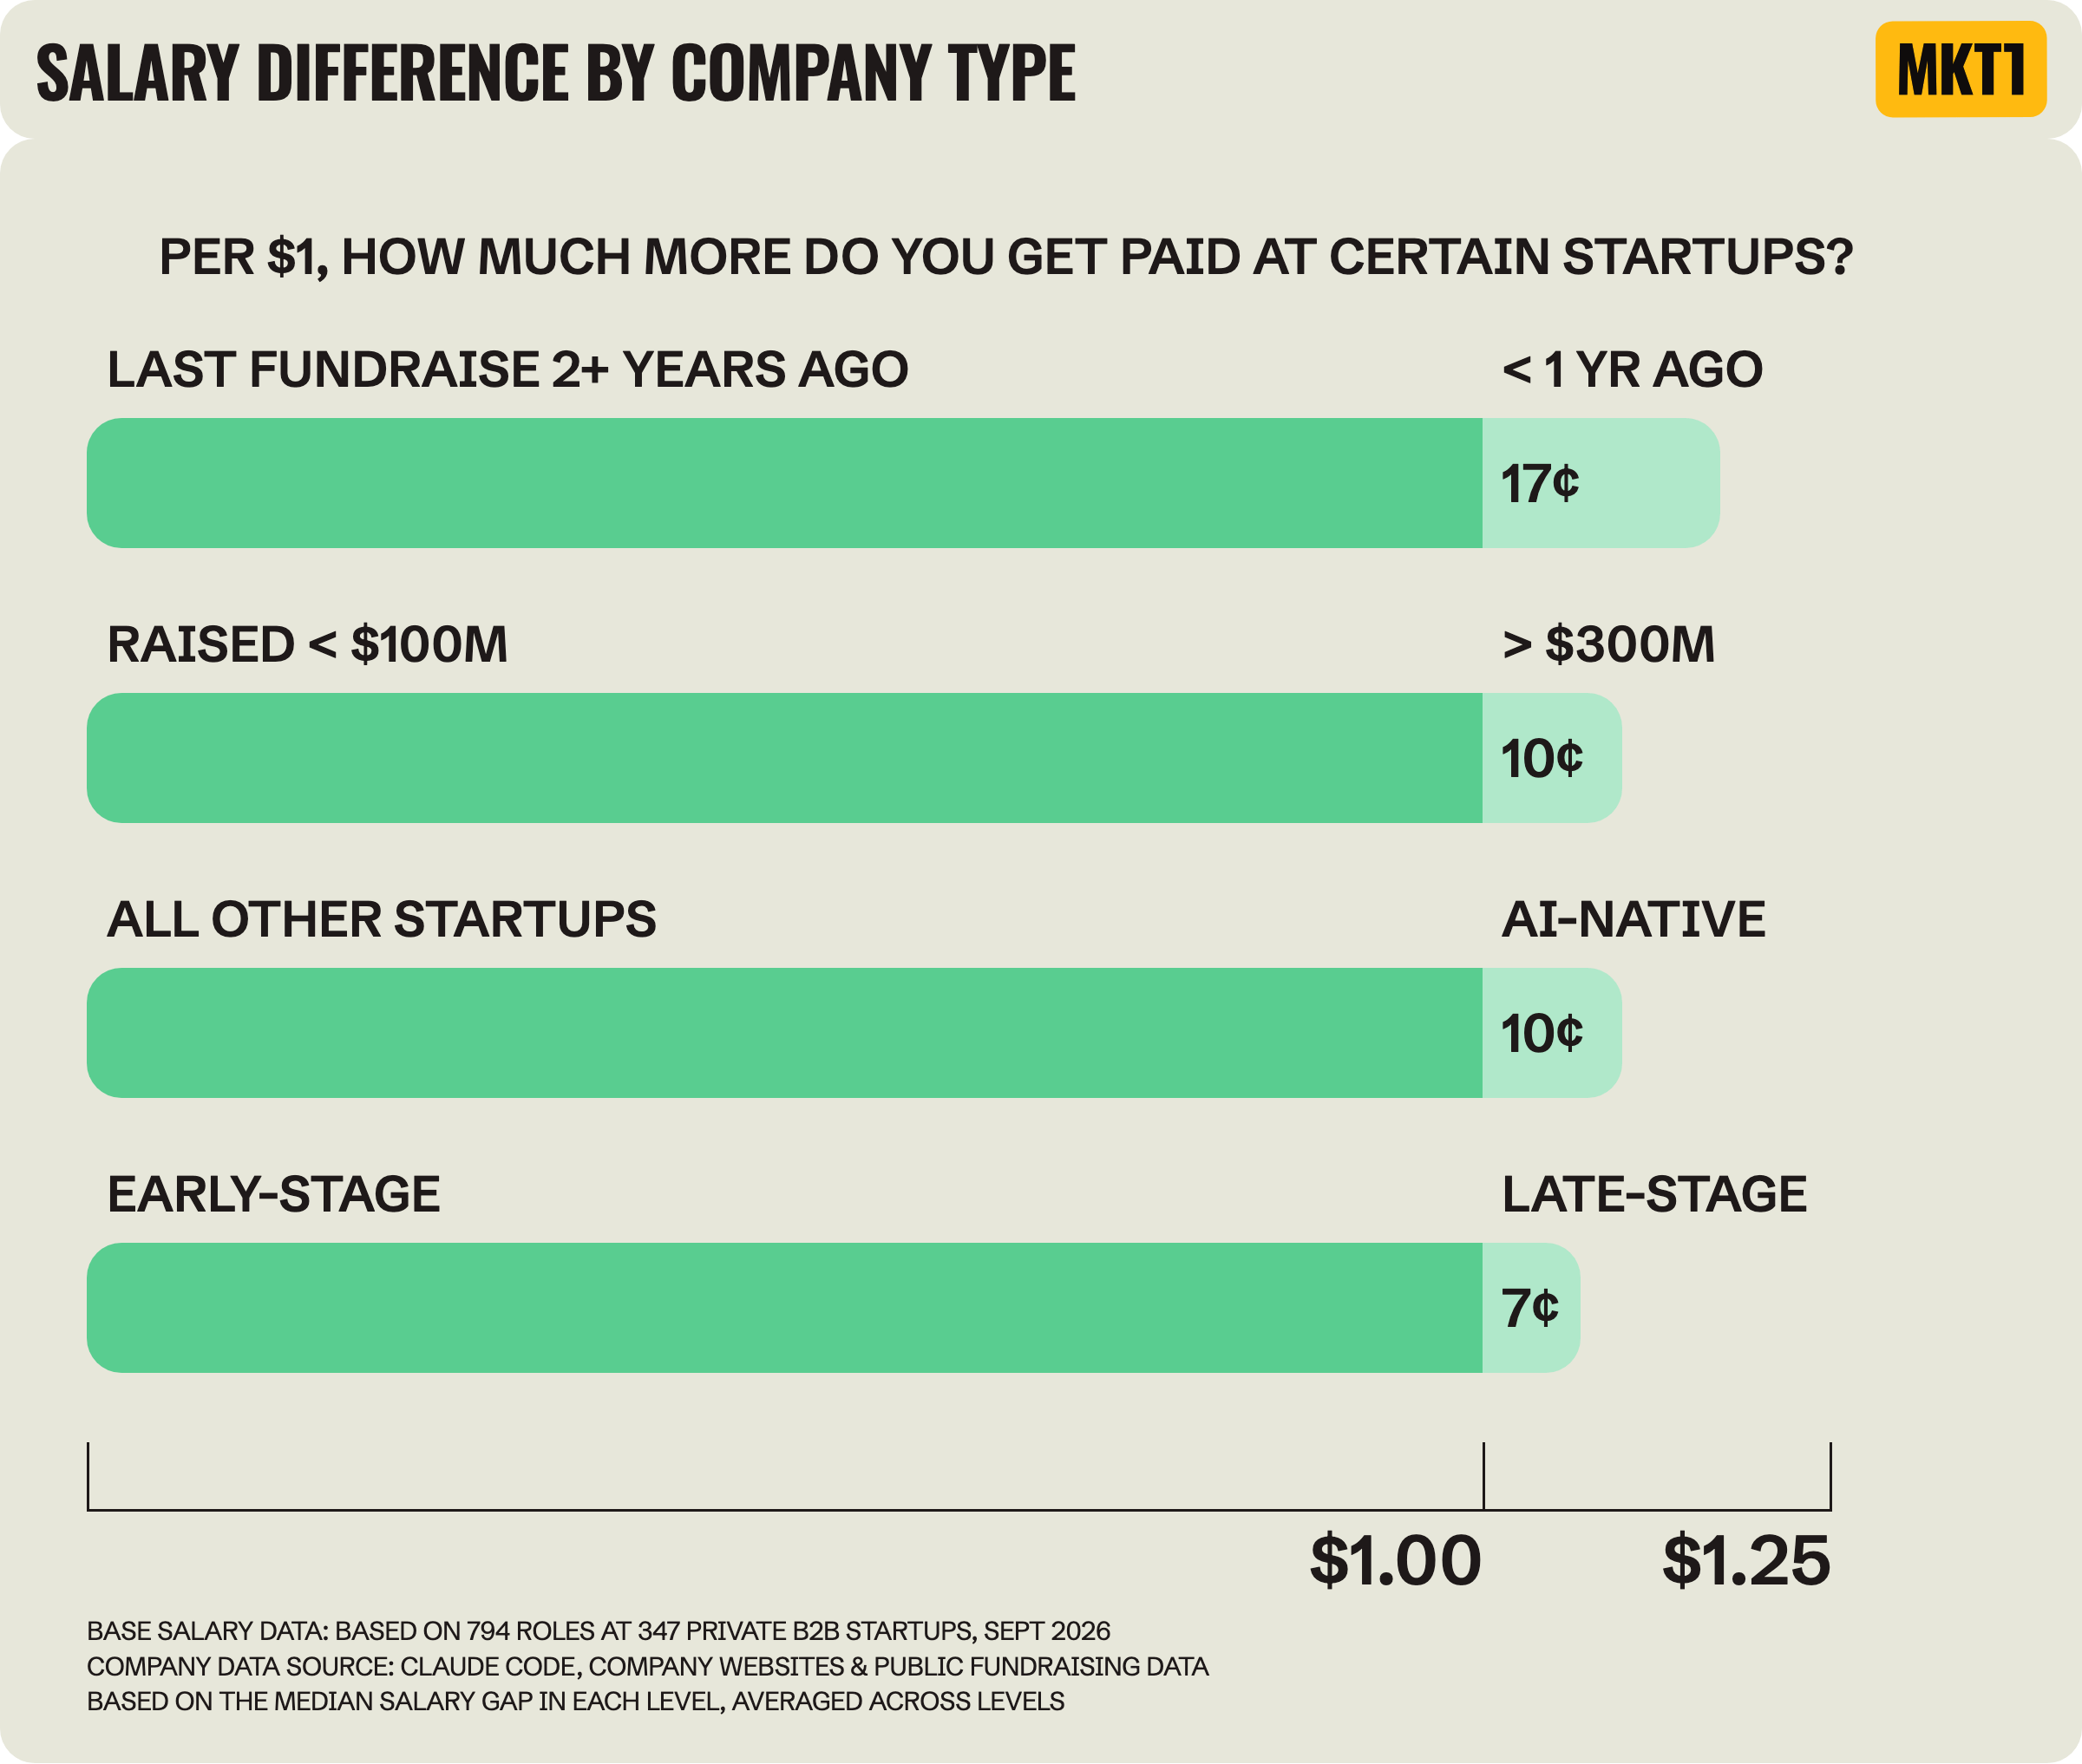
Other than working at OpenAI or Anthropic, how recently a startup raised matters more for salary than any other company factor I looked at.
Startups that raised in the last year pay about 17% more, more than being AI-native (10%), raising $300M+ (10%) or being late stage (7%).
I can't tell you how long it took to get this dollar chart to look half decent, I still don't love it but I had to give up...AI was $0.00 helpful in this case.
Find your next role on the MKT1 Job Board
See currently available jobs from vetted companies on our job board. You can also search the job board in Claude for free (this is one of several skills available to anyone who installs the MKT1 MCP!).
I'll break down each company attribute’s impact on salary a bit more...
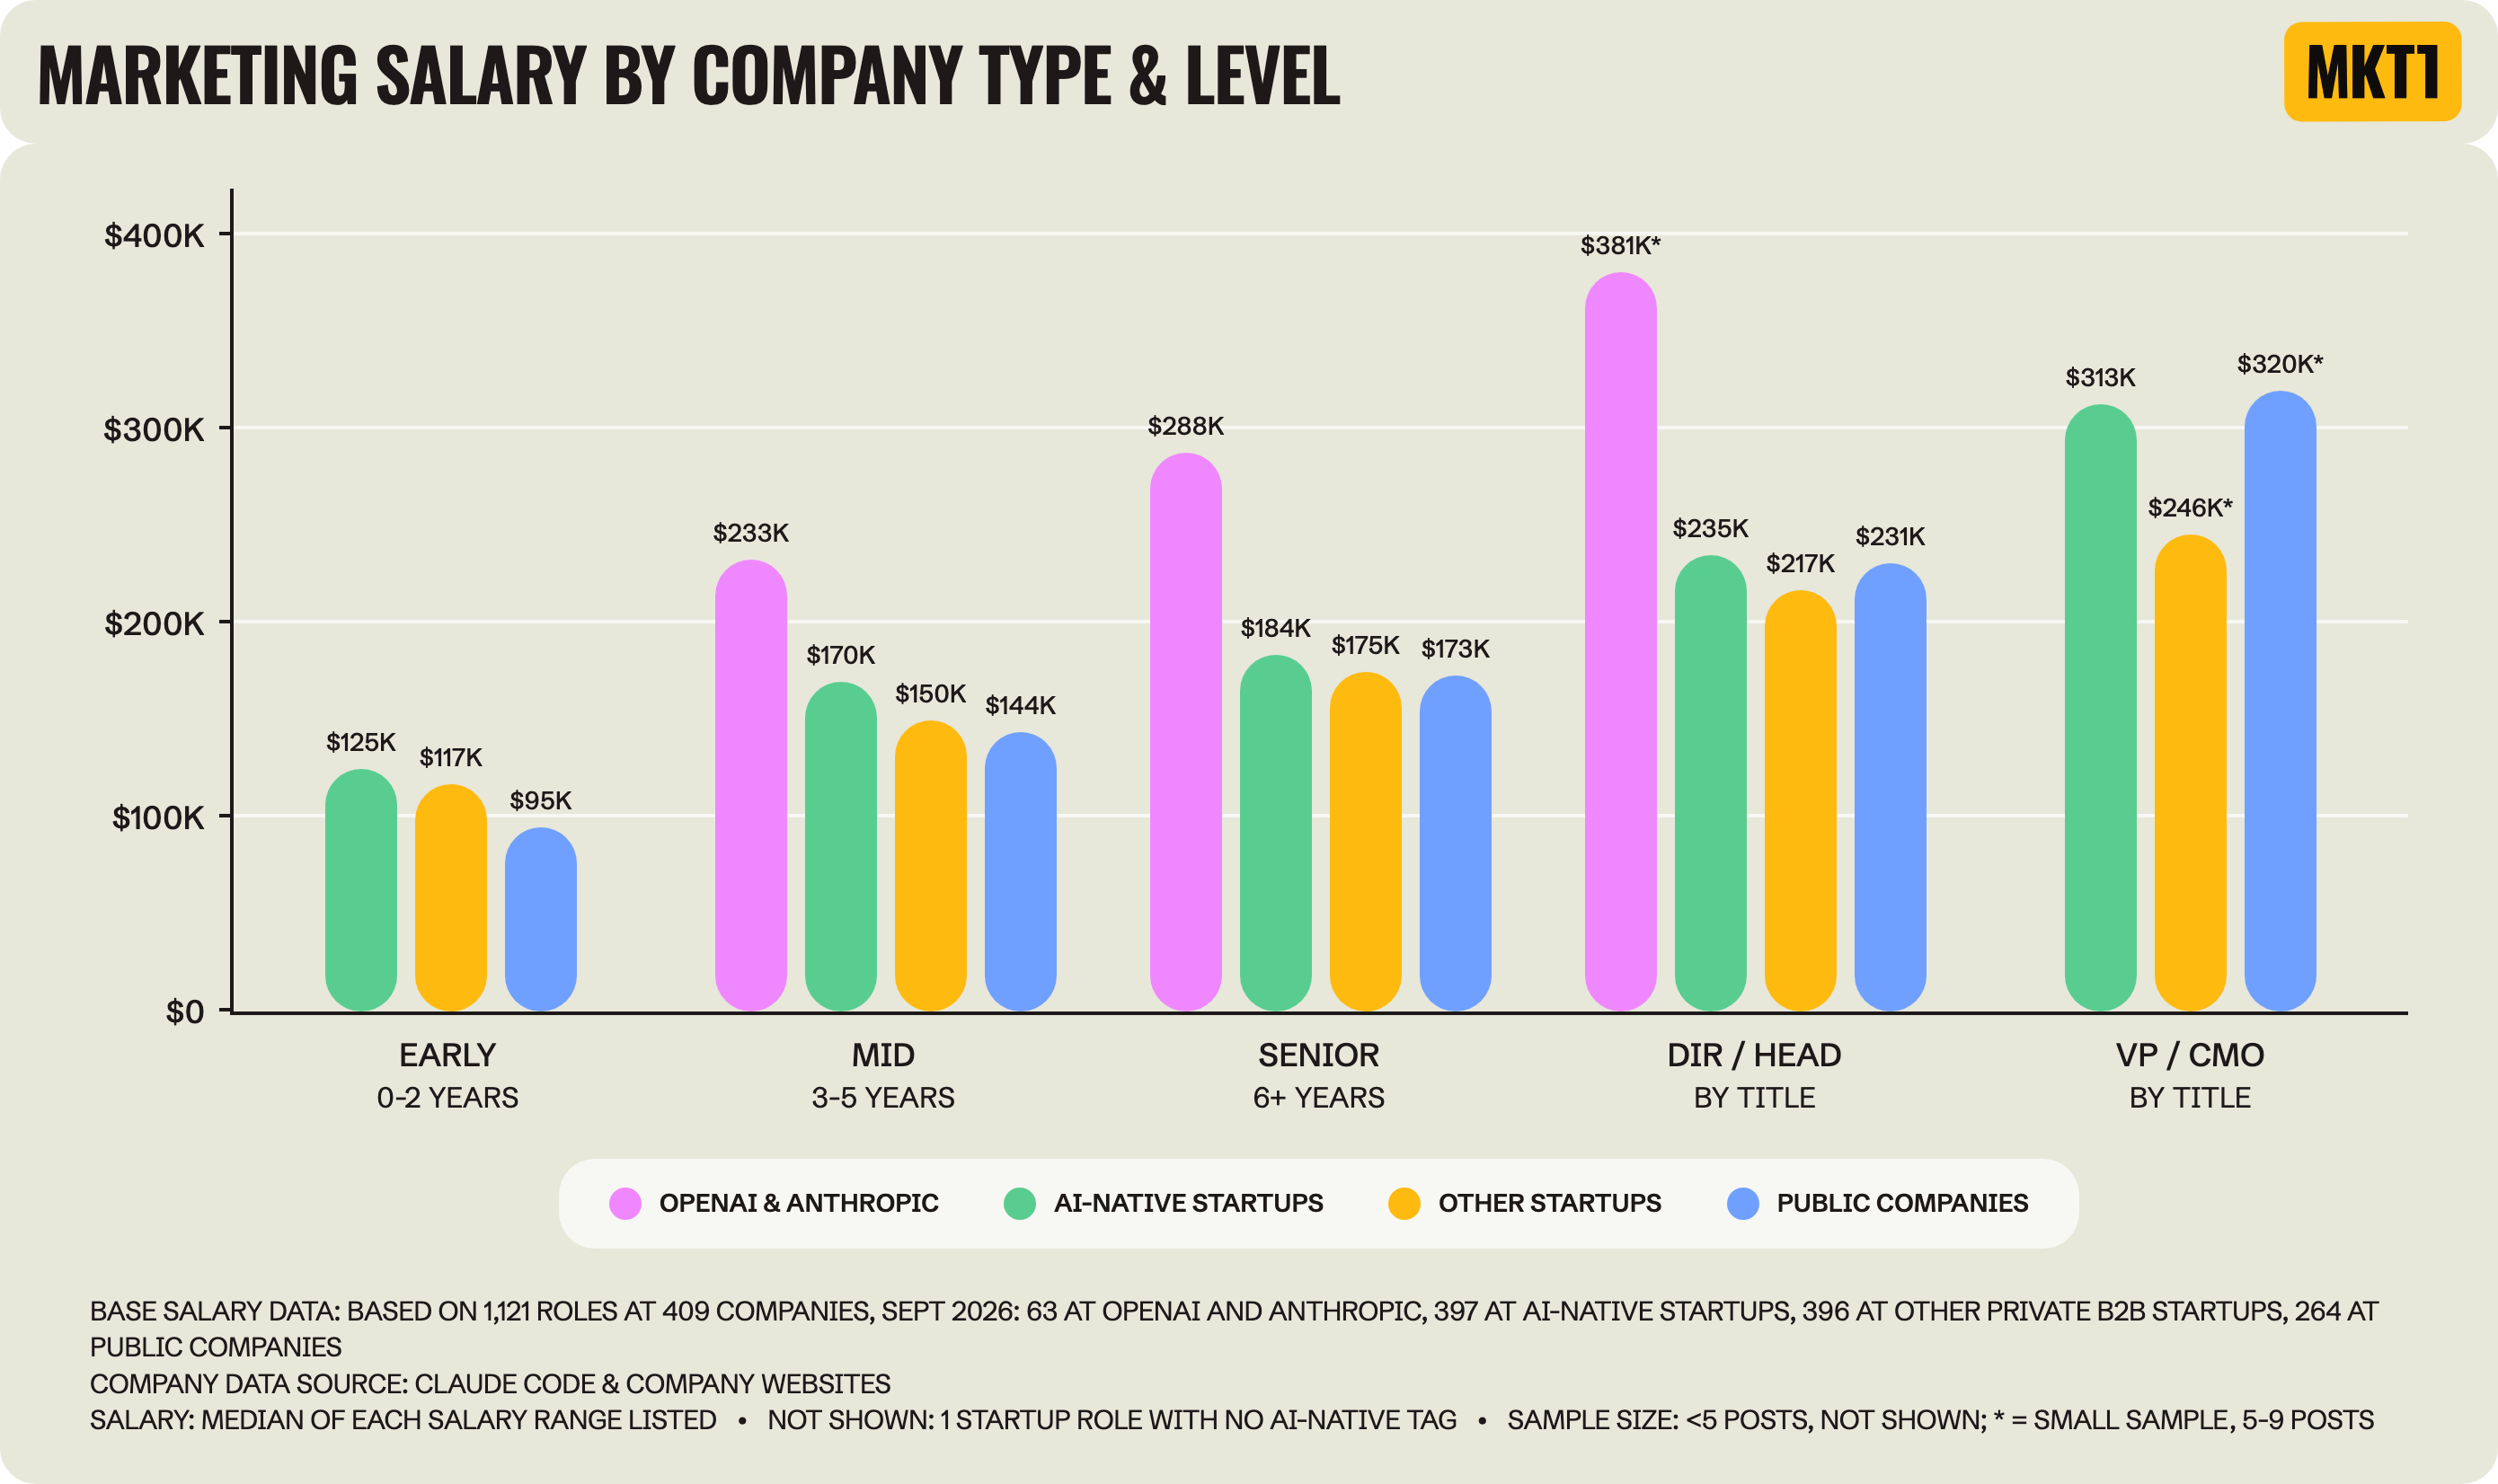
OpenAI & Anthropic are operating on an entirely different pay scale. Given this, and the volume of open jobs at these companies, I left them out of most of the graphs so they wouldn’t skew the data.
At the senior level, OpenAI & Anthropic marketers make a median of $288K vs $178K at other startups, a $110K or 62% increase.
The biggest gap between OpenAI & Anthropic and everyone else is at Director / Head of, where they make a median of $381K vs $225K, a $156K or 69% increase. It's a small sample (5 job posts), but it's a striking difference. A Director at OpenAI & Anthropic makes more than a VP / CMO at other startups, a median of $381K vs $300K. Wild!
There aren’t bars on this graph at the early-career or VP / CMO level because I didn’t find a single open marketing job that fit the bill. Most of their job posts (45 of 63) are senior roles. I'll talk more about this entry-level role situation in Part 2 of this newsletter series.
Even outside of OpenAI & Anthropic, AI-native startups pay more than other startups at every level.
Mid-level marketers at AI-native startups make a median of $170K vs $150K at other startups, a $20K or 13% increase.
The biggest gap is at VP / CMO: $313K at AI-native startups vs $246K at other startups, a $67K or 27% increase. AI-native startups also posted far more VP jobs than other startups (16 vs 6), which I guess is also saying something in itself.
Public companies pay the least for early-career marketers: A median of $95K vs $119K at startups, a $24K or 20% decrease. But their early-career jobs are true entry-level roles, like associates and new-grad programs, while at startups these jobs tend to be mid-level jobs with junior titles (not my favorite fact). More of the public company jobs are also outside SF and NYC.
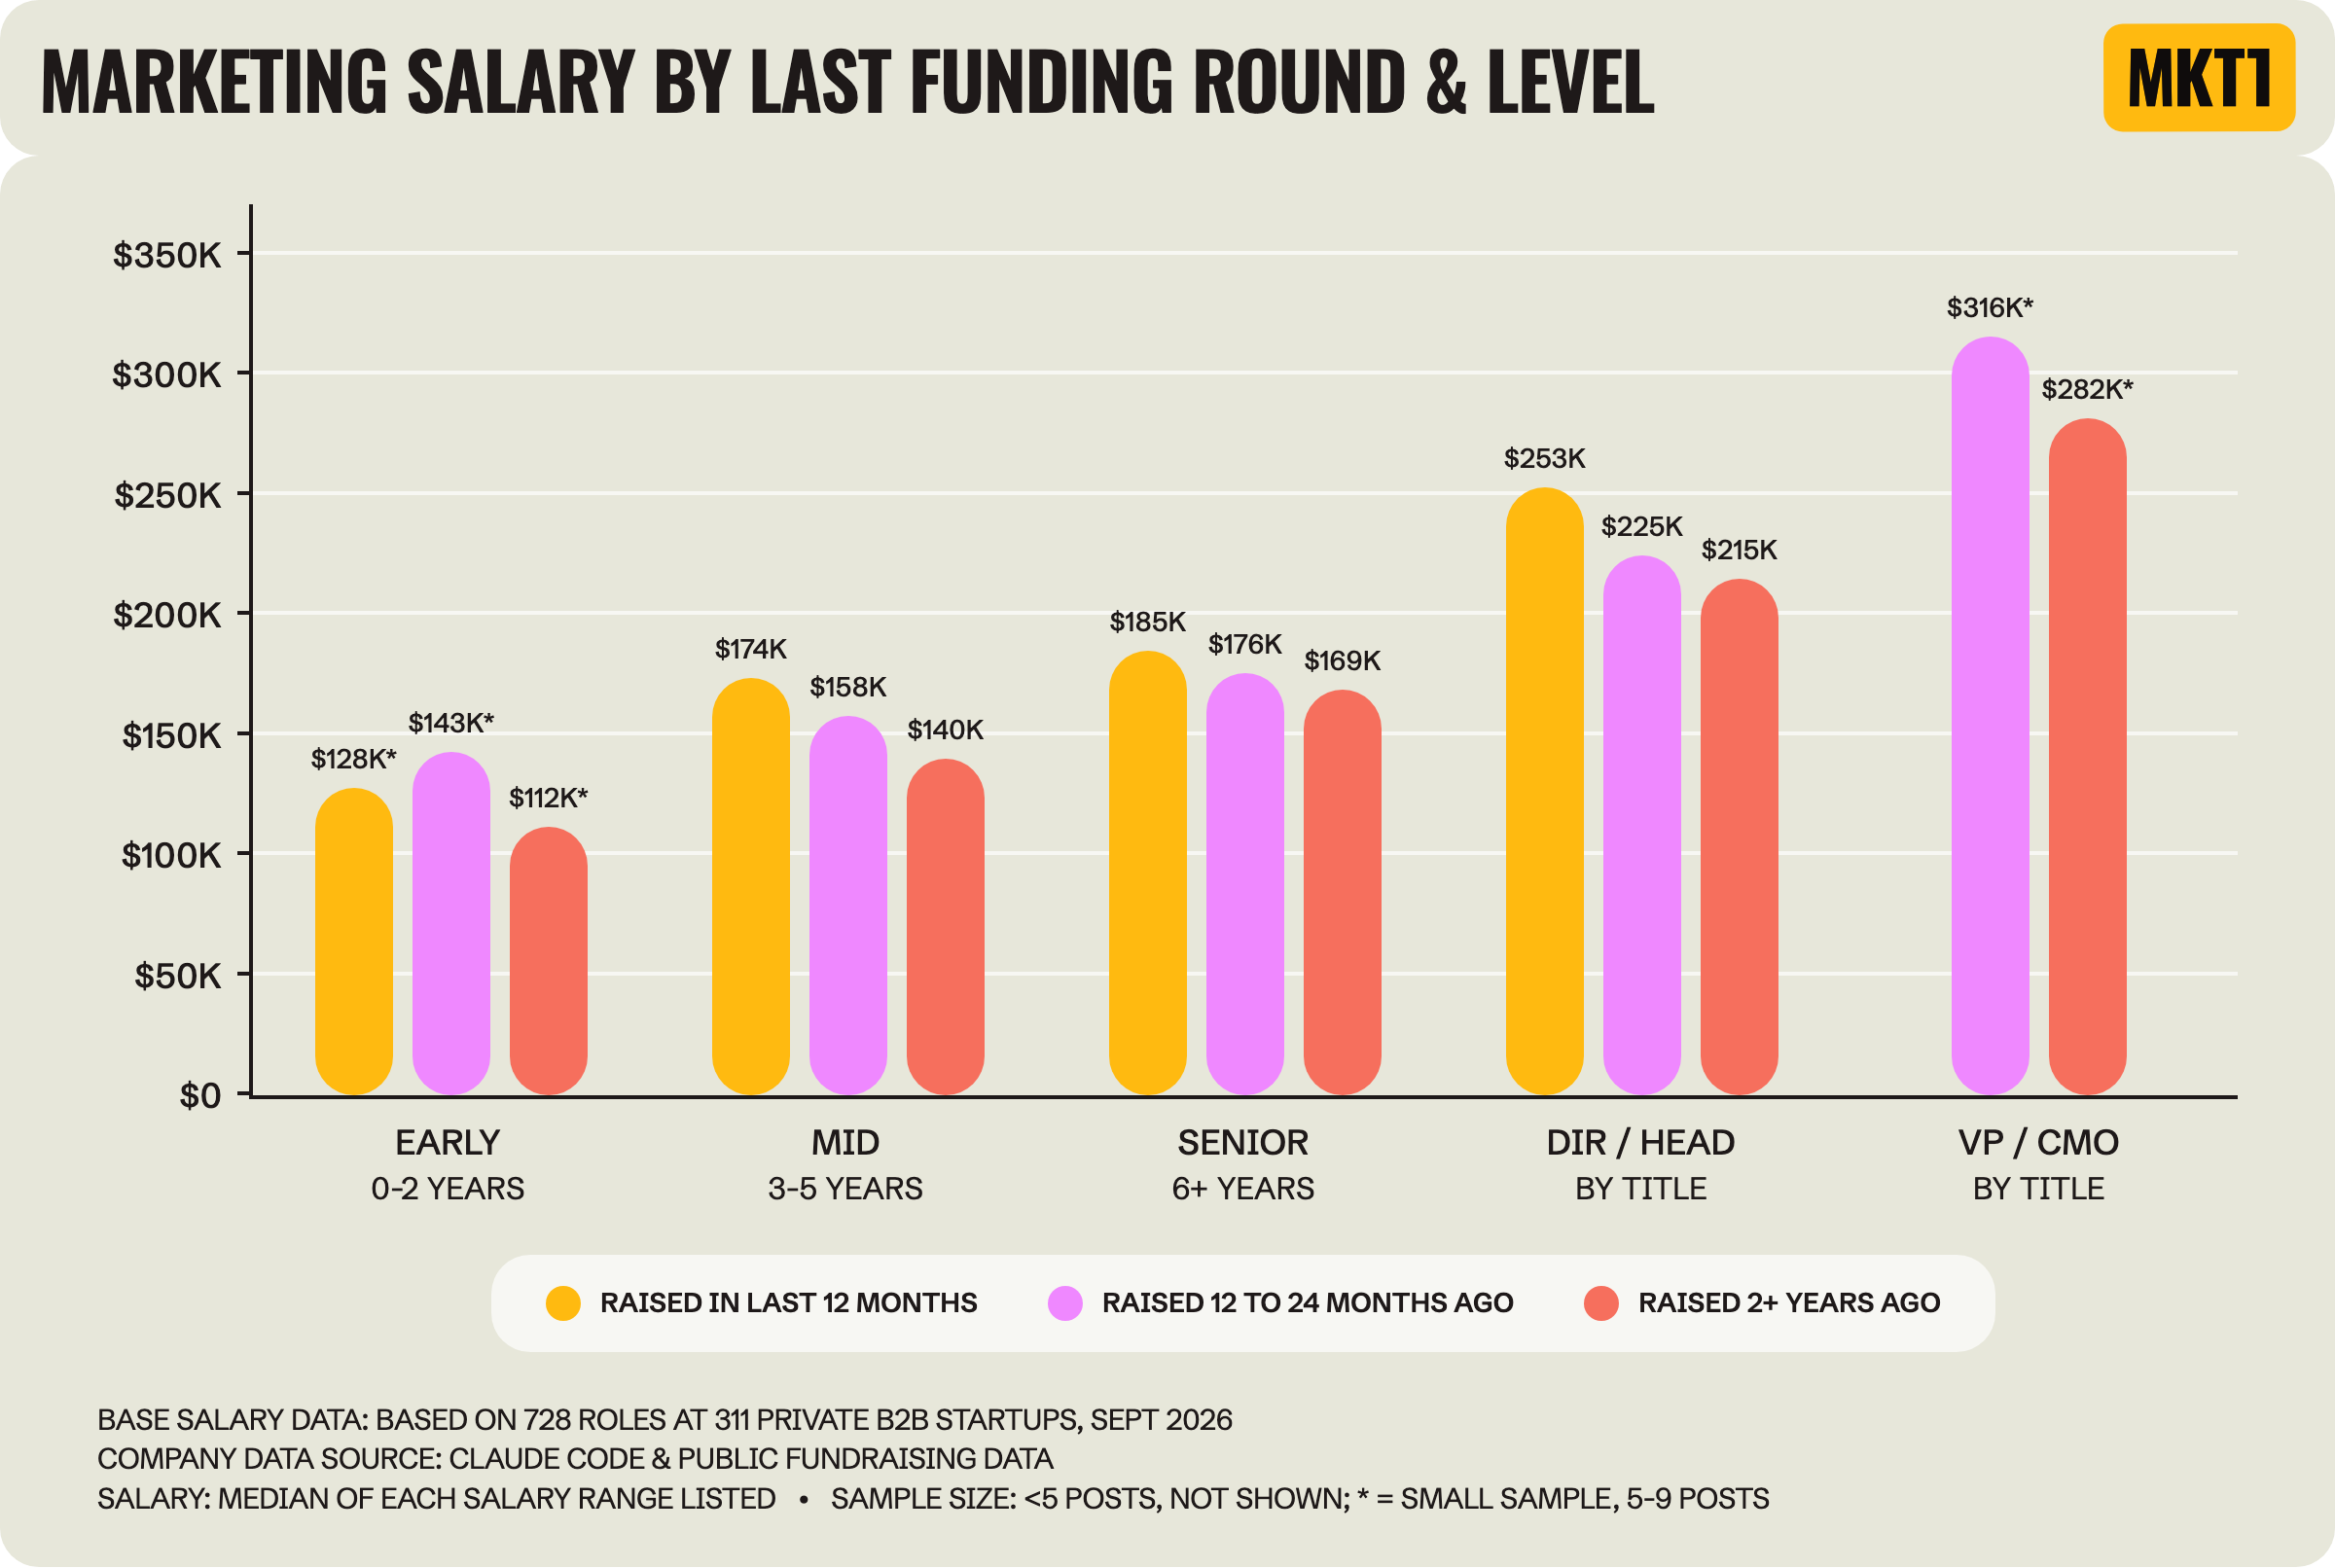
Fresh money in the bank matters. This makes intuitive sense, but I haven't seen it broken out before: The more recently a startup raised, the more it pays, at every level except early-career level (where the samples are small).
For mid-level specifically, there's a $34K or 24% increase from the oldest to the most recent fundraise: Marketers make a median of $174K at startups that raised in the last year, $158K at those that raised 12 to 24 months ago, and $140K at those that last raised 2+ years ago.
Want more company breakdowns? They’re in the appendix for paid subs
They break down salary by additional company details, like company size, stage, total raised and company category. Plus, how often marketing jobs offer a bonus or commission on top of base salary (spoiler: Not often). Jump to the Appendix »
How salaries have changed since 2022
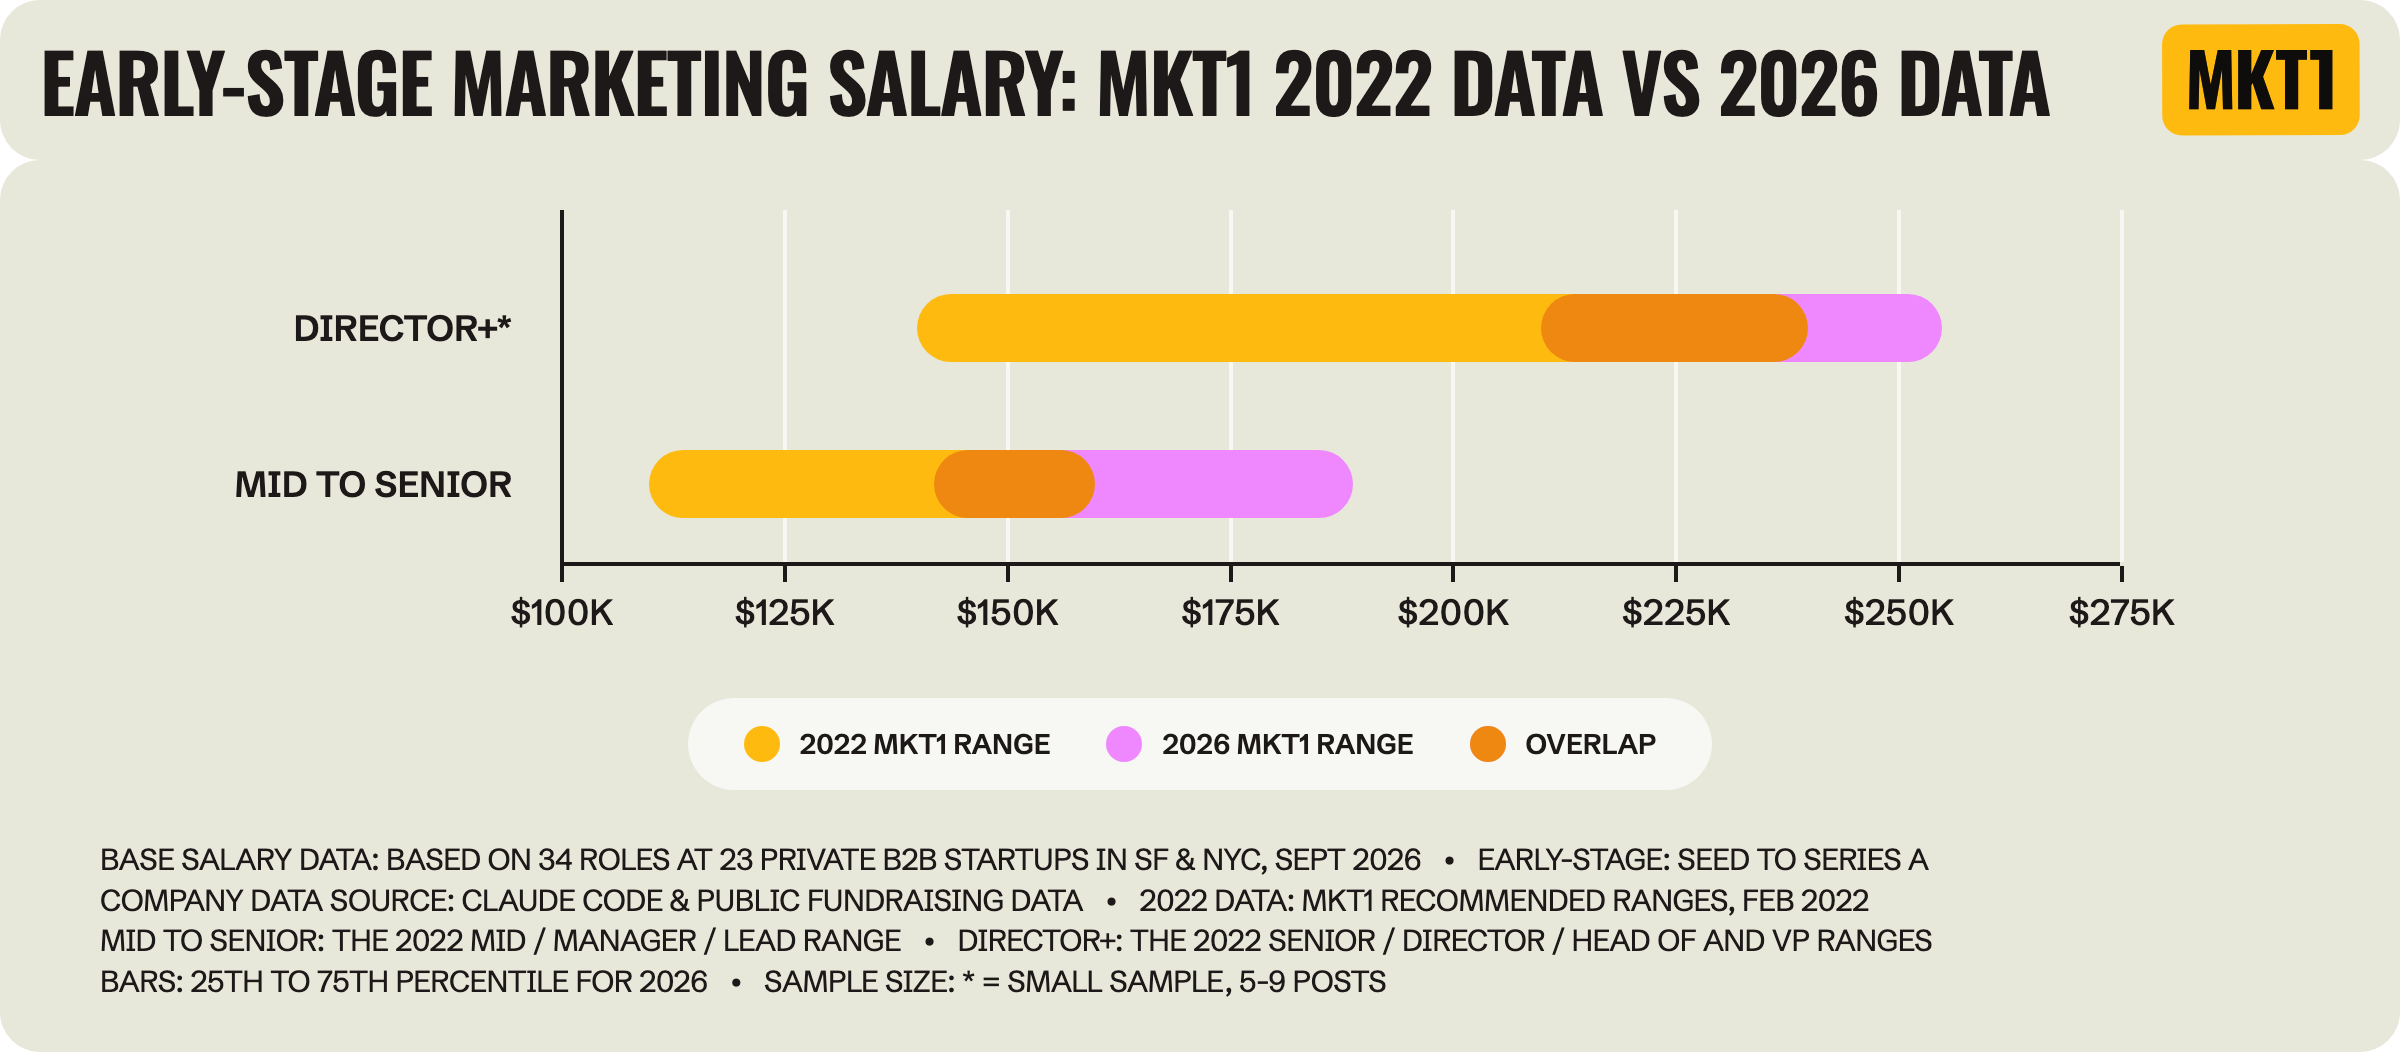
As I mentioned, in February 2022, I wrote a newsletter on early-stage marketing compensation with salary ranges by level. Those ranges came from hundreds of conversations with founders, investors, recruiters, and marketers who sent me their offers to review (I offered this as a free service for a while!), not from job posts like this report. The report only covered Seed and Series A startups in SF and NYC. I decided it would be fun to compare those to today, even though the nature of the studies was quite different. To keep it as close as possible, the graph only uses today's early-stage startups in SF and NYC.
Worth noting: February 2022 was right at the end of the startup boom. US venture funding fell from a record $358B in 2021 to $162B in 2023, then came back with AI, to $339B in 2025, with about two-thirds going to AI companies, which is likely why you see AI companies paying so much more (PitchBook-NVCA).
Once you adjust for inflation, mid- to senior-level salaries are about where they were in my 2022 report.
The graph shows my 2022 ranges as published. The numbers below adjust them for about 18% inflation, February 2022 to August 2026 (based on BLS data). The 2026 low and high ends are the 25th and 75th percentile.
The middle of the range for mid- and senior-level roles is basically the same once adjusted: $159K in 2022 (in today’s dollars) vs $163K now, only about $4K higher.
The only real change is the low end (25th percentile) of today’s salary range, which went up about $13K ($130K to $143K). Meaning, fewer jobs pay at the bottom of the old range. This is a positive, though the number of early-career jobs is still bleak.
Simply, the 2022 data holds up when you adjust it to today’s dollars. Great news for people who have been looking at that newsletter for the last 4 years.
Equity by stage
Job posts very rarely say how much equity compensation you’ll get, so this table isn't from the job post data. It's based on my own experience and data from a mix of public sources.
This could be a whole newsletter, but I’m sharing the basics below. And I'm building a full skill to help you evaluate equity that will be free in our MCP by Monday...maybe even by tomorrow (Friday). I'll share it on LinkedIn and Substack Notes when it's done!
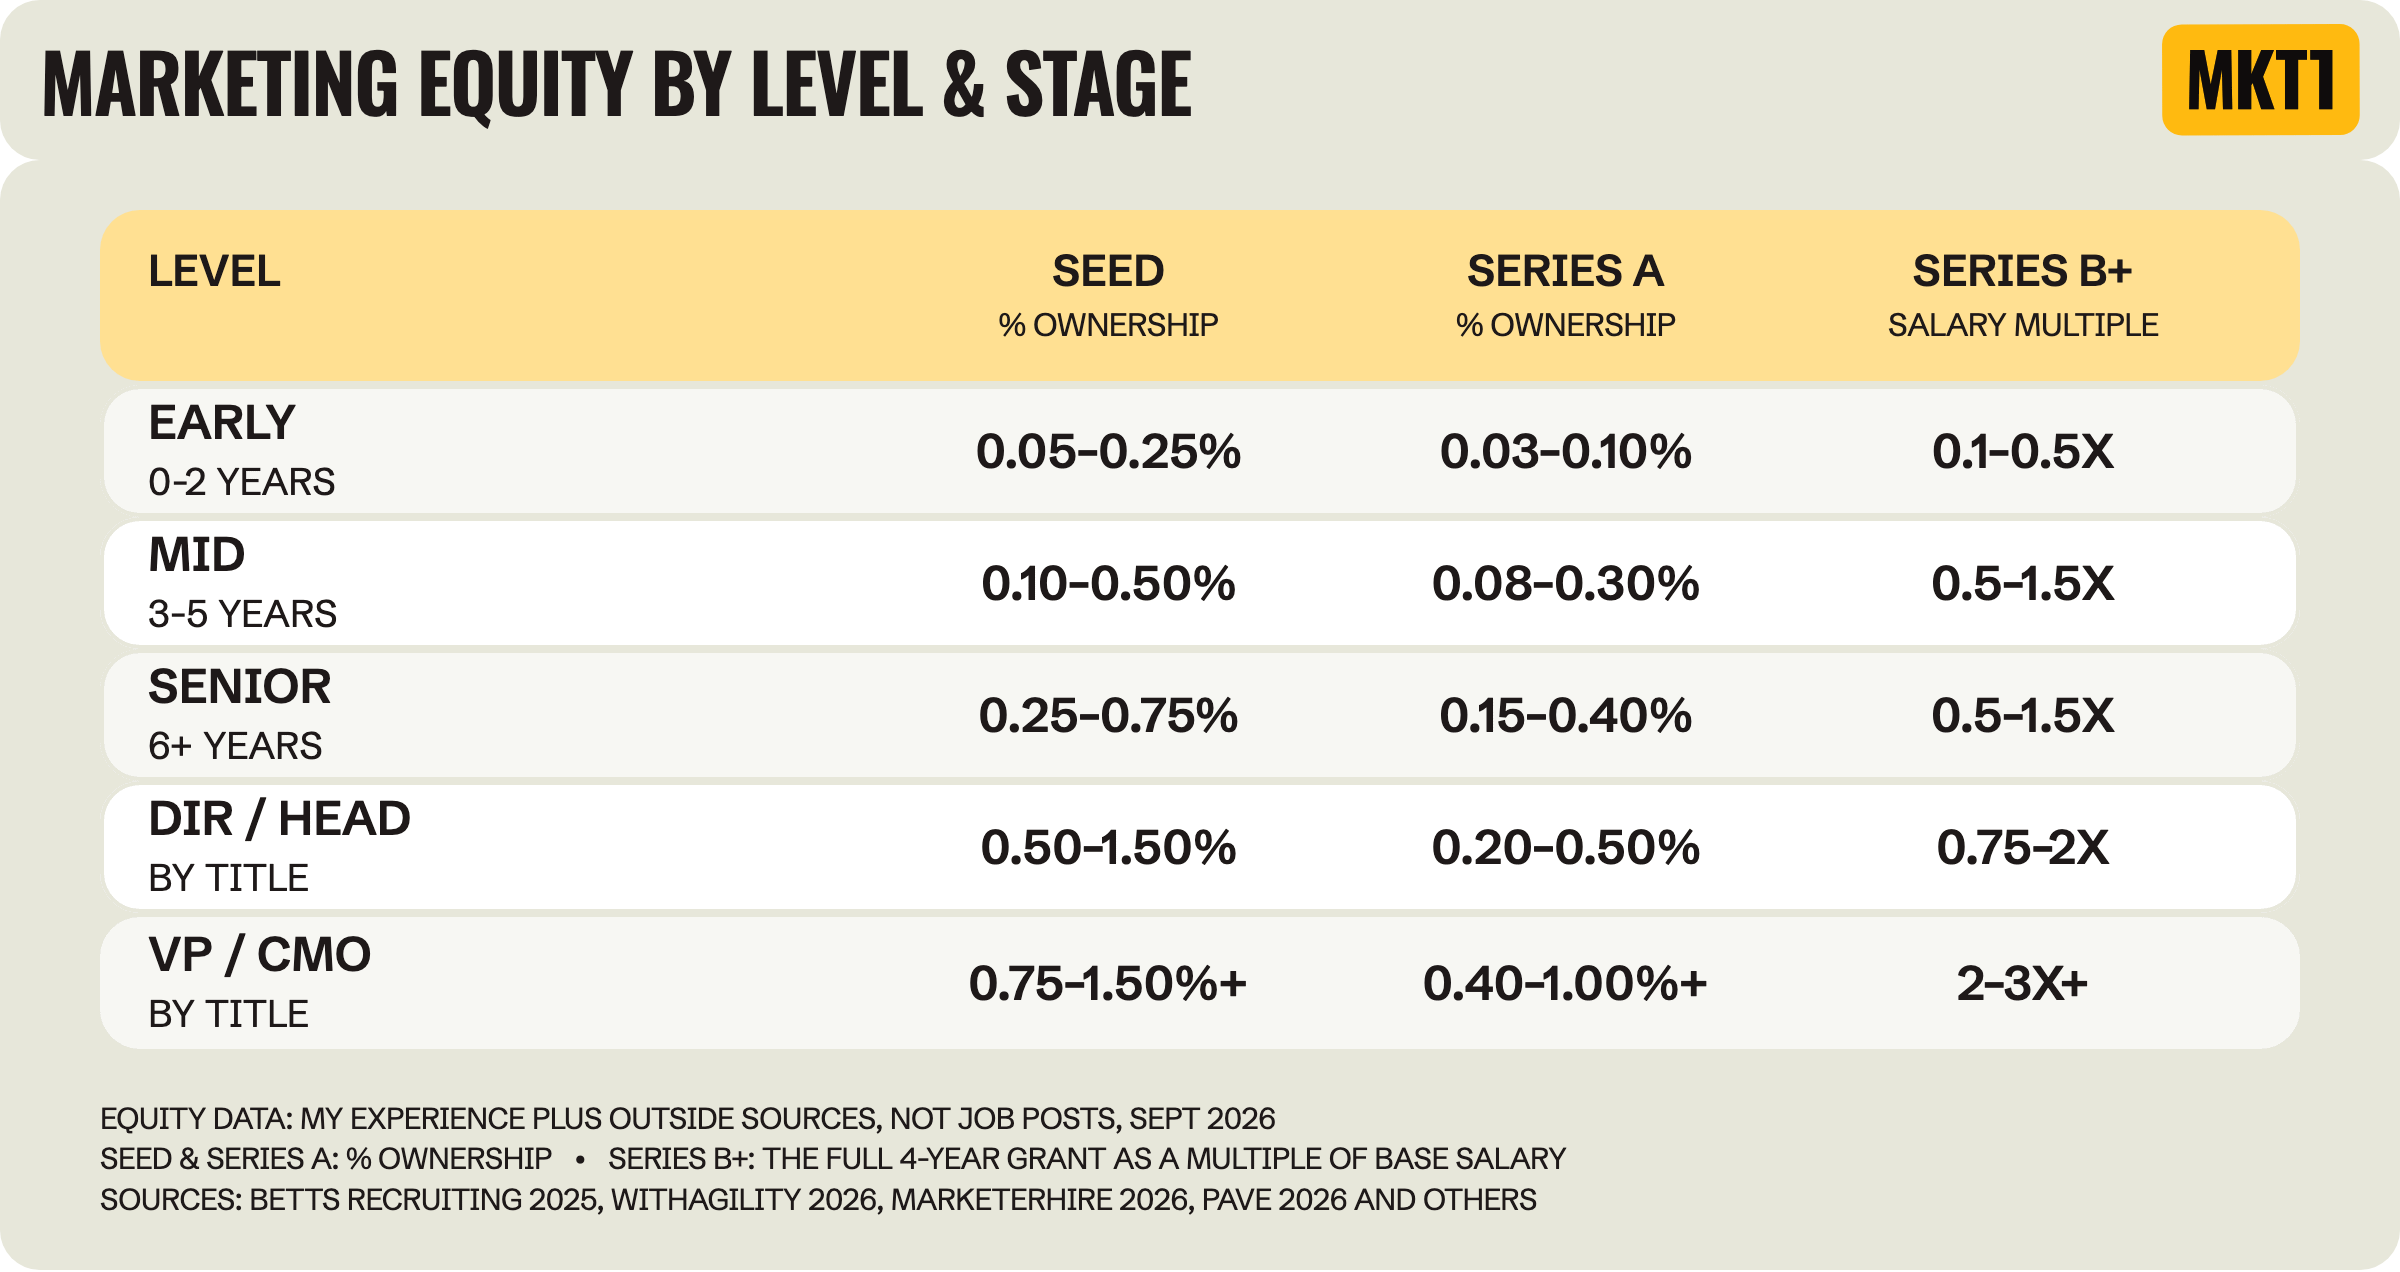
How to read this table and benchmark an equity offer:
At Seed and Series A, use % ownership: This is the number of shares you're granted over the full 4 years (or whatever the period is) divided by the company's total shares outstanding. The current dollar value likely won't be super meaningful at this stage, so % ownership is a great way to compare across startups.
At Series B and later, use current value (or at very highly valued Series A companies): This is the "paper value" of your shares based on the latest VC valuation, minus what you'd pay to exercise. Use it here because % ownership gets very low at later stages for most employees and it’s very inconsistent. Later-stage companies also tend to set grants as a dollar value per level.
Current value is shown as a multiple of your salary. It compares 1 year of salary to your full equity grant, which usually vests over 4 years. A 1x multiple on a $200K salary means about $200K of equity over 4 years, or about $50K a year. I prefer to do it this way, since salary can vary a bit while these multiples tend to stay more consistent.
The table's ranges may be off if a company raised much more or less than a typical Seed or Series A round.
At Series B+, mid-level and senior level have the same salary multiple (0.5 to 1.5x), but senior-level marketers still get more equity in dollar amounts, because the multiple is applied to a higher salary.
The main takeaway: Expect your ownership percentage to drop fast after Seed. A senior marketer gets about 0.25% to 0.75% at Seed vs 0.15% to 0.40% at Series A. The extra equity early on is there to compensate you for the risk, and maybe the 9-9-6 of it all. (We kind of stopped saying this phrase, but I think it's very much still going on, and not just at the earliest stages.)
What do you need to evaluate an equity offer?
If you pick the wrong company, equity is meaningless, and you can even waste money exercising it and paying taxes.
Given this, prioritize the salary you need to cover your current life. Think of equity as a potential future bonus. As an employee and investor, I've learned it doesn't always play out like you expect (in both directions). Here's how to do your own "calculus" on an equity offer.
You need 4 things to evaluate an equity offer in the ways I described above:
Number of shares and vesting schedule: How many shares you're granted, over how many years (usually 4), and the cliff (usually 1 year before anything vests).
Strike price: The price per share you'd pay to buy your shares. It's set at the fair market value (FMV) from the company's last 409A valuation (the value it sets for tax purposes), which is usually well below what investors paid in the most recent round.
If the startup later has a down round (raises at a lower valuation than before), your strike price doesn’t automatically go down with it, so your shares can end up being worth less than what you’d pay to buy them.Total shares outstanding: The fully diluted total number, counting every share and option that exists or has been set aside. Divide your shares by this number to get your % ownership. You'll usually need to ask for this.
Latest post-money valuation: The valuation you see in the headlines that dictated the price investors paid for their shares. Multiply it by your % ownership (then subtract what you’d pay for those options) to get the current value of your equity. Ask for this too—the latest public number might not be the real one.
Other things to ask about and watch out for:
Early exercise: At early-stage companies, when it doesn't cost much to buy your shares, ask if they allow you to buy them before they vest. It can save you a lot on taxes.
Post-termination exercise window: Ask how long you have to buy your shares after you leave. 90 days is standard, but some companies give 5 to 10 years, and it can matter a ton. For instance, Asana gave us 10 years, so in theory I didn't have to buy any shares until the day it went public, which took the risk out.
If a startup gives you a long window, I'd value the equity way more than at startups that don't. Just my 2 cents, or 2 million cents potentially.Refresh grants: Ask whether they give more equity over time, and when.
Tender offers: Ask if they've done one or plan to, so you can sell shares before an exit. They won't have done this if they're very early, but they might have a plan. Remember: Founders will always say they want to do this, but only very in-demand startups can pull it off, because they need investors willing to buy employee shares.
Acceleration: Ask what happens to your unvested shares if the company is acquired, including before your 1-year cliff. You'll usually only get great terms here at the exec level.
Liquidation preferences: When a company sells, investors get their money back before employees see anything. Usually the liquidation preference is 1x, meaning they get back what they put in first. Sometimes the liquidation preference is higher, which means investors get back more than they put in before anyone else gets paid. This gets more likely when a company raises at a lower valuation (a down round), raises a lot of rounds, or zombies along for a long time before an exit.
Location: Many companies now reduce equity more than salary outside top cities. Pave's data found new-hire equity runs 29 to 36% lower outside major cities, vs 11 to 16% lower for salary. This surprises me, I’m of the mind that equity should not be adjusted this way.
Check out my comp newsletter from 2022 for more equity help. And be on the lookout for my free skill to help!
Fine print: The equity ranges are based on anecdotal, aggregated, anonymized data and public sources, not statistically significant data. There may be errors, and I'm open to feedback and edits.
Minus the full methodology, and more graphs for paid subscribers in the appendix (keep scrolling), that’s it for Part 1 of this series.
I hope this helps you go into your next offer (or your next raise conversation) knowing what you’re worth. If you see something that looks off in the data, or something you want me to dig into, let me know in the comments.
Part 2, a deeper dive on the open roles and what’s in the job descriptions, is out in 2 weeks.Thanks for reading this far!
-Kramer
More methodology
Details about the companies in the study:
How I found the companies and roles: I started with companies I've looked at by hand: The ones on the MKT1 Job Board, the B2B 100 from my spring State of B2B Marketing report, and the MKT1 Vetted B2B Startup List in the MKT1 MCP. Then Claude Code searched the hiring systems companies use (Ashby, Greenhouse, Lever and Workday) for open marketing roles at other startups, to fill in the gaps. In total, Claude checked 1,600+ company career pages and reviewed 2,255 marketing job posts. The 1,121 in this report are the ones that fit: US-based, full-time, with a salary listed.
Why US only: US job posts are the ones most likely to list a salary (thanks to state pay transparency laws), and salaries vary so much by country that mixing them would muddy the numbers.
What’s included in the study: Private B2B startups, prosumer tools, B2B marketplaces, and OpenAI & Anthropic. (This is the ICP for MKT1 Newsletter, but we welcome readers of all stripes.)
What’s not included in the main graphs: Public companies, companies owned by a bigger company, private equity and buyout-owned companies, and consumer companies. When I wasn't sure about a company, I left it out.
AI-native definition: AI-native product from founding, not an older pre-AI product. Can be in any category. Based on judgment calls made by Claude and MKT1 for each company.
How I calculated salary:
Salary listed: Most marketing job posts list a salary now (87% at the companies I looked at by hand). When one doesn't, the salary is usually listed somewhere else, the job is somewhere that doesn't require it, or the company just skipped it, often even in SF and NYC, where it's required.
US base salary only: Some job posts only list OTE (on-target earnings: Base plus bonus or commission). For those, I counted the low end of the range as base.
Midpoint: I used the midpoint of each posted range.
Medians: Every number is a median, not an average. I checked: They're within about 3% of each other at every level.
Missing data: If I couldn't categorize a role or company, I left the job post out of that graph. So not all graphs have the same total number of jobs. For example, 66 job posts aren't in the company category table: 28 at companies that don't fit a category and 38 at companies I couldn't categorize.
Duplicate job posts: When the same job was posted separately in several cities, it counts once. I kept the highest-paying US version.
Location: The main graphs mix all US locations together. If a job post lists a different salary range for each city, I used the highest one, which is usually SF or NYC. The one exception is the location table, where the job counts in each city at that city's range. The location table sorts jobs by where they're based: SF, NYC, other US cities or remote. The "10 to 15% less outside SF and NYC" comparison uses the 72 jobs that list a range for 2+ cities.
Remote: Remote means the job board, the job's location, or the job post itself said the job is fully remote. Hybrid and in-office both count as not remote.
Sample size: I aimed for 10+ job posts behind every number. 5 to 9 are flagged as a small sample, and under 5 aren't shown (a blank on the graphs, a dash in the tables).
How I organized levels:
The 5 levels I used: Early career (0 to 2 years), Mid (3 to 5 years), Senior (6+ years), Director / Head of, and VP / CMO.
How a job gets its level: Director and above go by the title. Below Director, the years of experience the job post asks for decides the level. If a job post doesn't list years, the title decides it (more below). When a job post asks for a range (e.g. 3 to 5 years), I used the middle of the range.
No years listed: 16% of job posts (128) don't include years of experience. Below Director, I leveled those by the title: Senior, Lead, Principal or Staff counted as senior level, and Coordinator, Associate or Specialist counted as early-career level. If the title had no level word either (e.g. a plain "Marketing Manager"), I counted it as mid-level. I used this method on only 57 job posts.
Side note: Titles are messy, about 40% don't have a level word!
Grouped levels: Director and Head of are grouped together because they're similar ranges and similar jobs (I checked the data to make sure this grouping was the best way to go). VP and CMO are grouped together because there are only a few of each and I think these titles are often given interchangeably. You can argue that, but that’s my 2 cents!
What’s included in each marketing “area”:
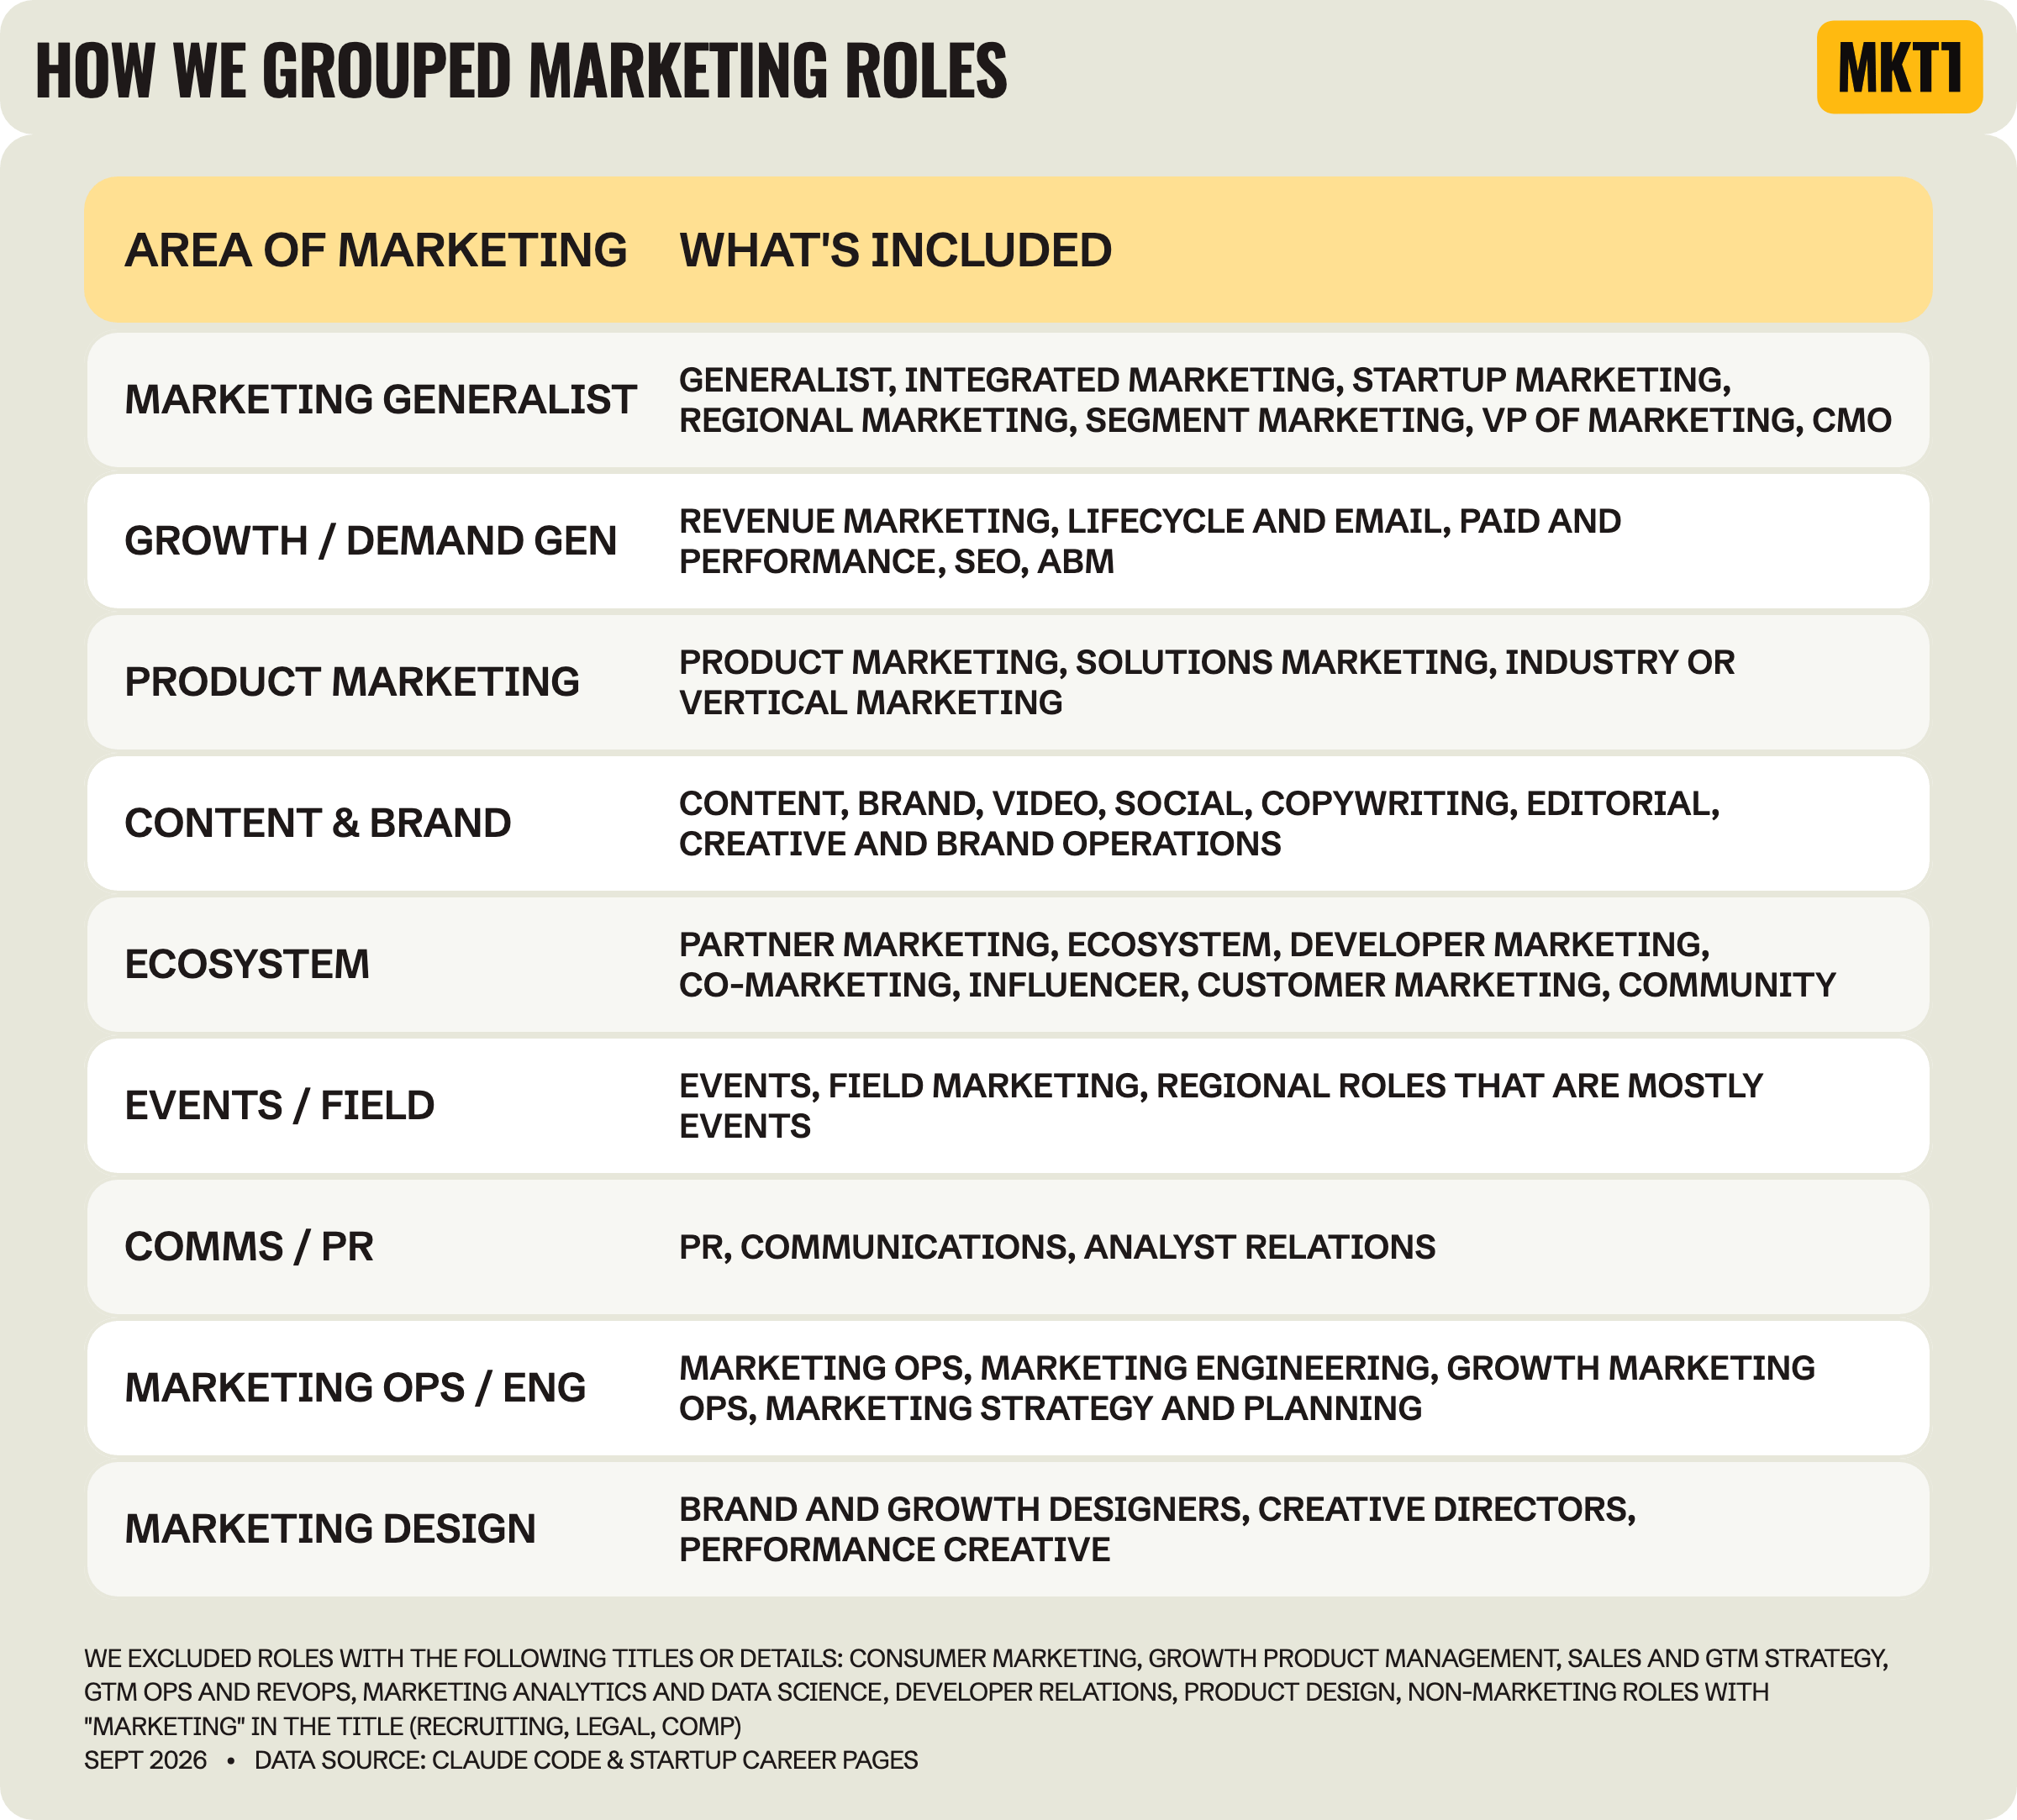
Sources and more details on how I built the report:
The full data: Every job in the study, with a link to its job post, is in the Marketing Salaries Data 2026 skill. Some jobs will have closed since September 2026.
The research: Claude Code did the initial research. I just asked it to use subagents to run the company research and job pulls in parallel, with different models for different jobs, and to push every job post and result to a database as it went. Company facts (funding, stage, headcount, AI-native, category) came from public sources in September 2026.
Time it took: I got 80% of the way there in about 5 to 6 hours, but I had a very clear plan, some ready-made skills and processes from my State of Marketing series, and a solid Claude Design setup with lots of graph types. The spot checking, finessing, insight pulling, question asking, deep diving and writing took about 25 to 30 hours. So the final 20% took at least 5 to 6 times as long as getting to the initial set of graphs. The last mile is always the hard part...
Equity table: The ranges from my 2022 post, updated with 2025–2026 data from Betts Recruiting, WithAgility, MarketerHire, Pave and others.
Caveats: There may be mistakes in the data. I primarily relied on web scraping to enrich the data, and made judgment calls when it comes to sorting jobs into roles and levels. This is not intended to be statistically significant, but instead directionally helpful to make sure you get paid fairly based on today's market. Nothing in this newsletter is financial, legal or tax advice, but if you want to say I got this data from MKT1 Newsletter in your negotiation process, by all means go for it!
More from MKT1
🙏 Brought to you by: Algert, a B2B brand and creative agency; Profound, the AI marketing platform; and Closing Media, a LinkedIn & Paid Media Agency.
💬 Bring this newsletter to Claude: Chat with this newsletter with this pre-built prompt. Tons to dig into here!
🔌 MKT1 x Lovable Buildathon on 10/28 at 10AM PT / 1PM ET: Come build apps and MCPs for your team or your customers alongside Kramer and the Lovable team. Register here.
🤖 MKT1 MCP: Add MKT1 skills to your LLMs or AI harness. Paid subscribers get our full library of 40+ skills and templates, including all the research skills featured in this newsletter.
🧑🚀 MKT1 Job Board: Jobs from the MKT1 community (it’s free to post as a paid subscriber). And our candidate form if you’re looking for a new role (option to remain anonymous included!).
🥞 MKT1 Perk Stack: Exclusive discounts worth $40K+ on our favorite GTM tools. For annual & superfan paid subscribers only.
🧰 Template & resource library: We have 100+ templates and resources available to paid subscribers in our template & tool library.
Appendix: More salary graphs
Do marketing roles offer variable comp?
About 1 in 8 marketing job posts (93 of 783) offer variable comp on top of base salary.