

How to calculate your marketing budget—and make sure it's efficient
Includes the budget template + efficiency metrics calculator I wish I had 10 years ago

👋 This is a monthly free edition of MKT1 Newsletter—a deep dive into a B2B startup marketing topic. This edition is brought to you by Unify, 42 Agency, & HubSpot. Become a paid subscriber to receive an additional 1-2 newsletters each month, access our archives, post to our job board, and use our template library.
You are likely finalizing next year’s marketing budget right now–and maybe pushing for more money for headcount, tools, ads, events, and marketing programs.
Figuring out budget requires triangulating between historical full-funnel data, efficiency metrics, and revenue goals—it’s not easy and it’s very mathy. Most of the guides, benchmarks, and templates miss the mark because they are built for finance teams, for later stage companies, or for paid ads budget calculations only.
I had to get a major refresher on all of this myself and I’m thrilled to be delivering the guide (and template) I wish I had when leading marketing at startups.
In this newsletter:
This post is an unofficial 4th newsletter in my 3 part annual planning series from this fall. This newsletter helps you set the right marketing budget to hit your revenue targets, while making sure you’re efficient in your spend:
SaaS business metrics & efficiency metrics explained—with benchmarks: including CAC, LTV, Payback Period, etc.
How to set budget based on new revenue targets & efficiency metric targets
How to allocate your marketing budget by category
Paid subscribers: A super-template and calculator to set your marketing budget, check it against efficiency metrics, and track progress throughout the year. I even threw in some bonus AI prompts to help you along the way. Plus, there’s a video coming in a few days walking you through the template in detail.
Recommended products & agencies
We only include sponsors we’d recommend personally to our community. Get in touch at sponsorships@mkt1.co.
—
Unify: Drive pipeline with one platform for prospecting, personalization, and engagement. Build outbound plays and sequences with 10+ intent data sources, plus deliverability management.
🎁Offer: Get in touch here and mention MKT1 1 month free on an annual contract.
📅 Come see their founder demo Unify at the MKT1 Showcase tomorrow morning!
—
HubSpot: According to HubSpot’s AI Marketing Trends Report, 46% of marketers are using AI for writing copy, 41% for content outlines, and 34% for research. Fascinating, as I use AI in the exact opposite way!
🎁 Download the AI Marketing Trends Report for free.
__
42 Agency: Start next year with a functional Hubspot instance using 42’s free Mops Workbook or reach out for full-service help hitting your ops and growth goals.
🎁 Offer: Mention MKT1 to get $500 off a Hubspot audit.
Before you set your budget: forecasting & efficiency metrics overview
Forecasting
Two forecasts are typically created during planning cycles: a top-down forecast from finance & sales and a bottom-up forecast created by marketing & finance. These 2 forecasts use different methodologies and aren’t the same thing—but both have the same goal, helping set a revenue target for the year.
Top-down forecast: Sales and finance create a top-down forecast starting from an ideal revenue target, then work backwards to determine what target metrics earlier in the funnel (like pipeline $) must be achieved to hit that revenue target.
Bottom-up forecast: Bottom-up forecasts start at the very top of the funnel (with web traffic and/or accounts in addressable market), then forecasts revenue based on historical data and planned increases in volume and conversion rates. (Bottom up starting at the top of the funnel is admittedly confusing, I didn’t make the rules here).
Why you need to forecast top to bottom and bottom to top:
The challenge with top-down forecasts is that they don’t take into account what’s actually possible at the top of the funnel, which is why the bottom-up forecast is also necessary. So, use a bottom-up forecast to determine what revenue target is possible, given the the planned marketing activities and goals.
So if finance says, “We need $5M ARR” and built a forecast for this, that means they made a top-down forecast and will give you targets based on that. But before you agree to those targets, marketing needs to map if that’s realistic by looking at planned activities and budget with a bottom-up forecast. If marketing does the forecast and thinks only $3.5 ARR is possible, it’s time for a cross-functional chat!
Why does forecasting matter to budgeting?
You can’t budget without a forecast and you can’t forecast without a budget–well you can but you’ll end up with a budget and forecast that are pretty much made out of thin air.
Budget for ad spend, marketing programs, and events directly impacts the activities you can do.
These activities directly influence what it’s possible to achieve this quarter, next quarter, and at the end of the year.
Based on how much you need to spend to drive the target revenue, you can figure out how much you can spend on headcount.
If you realize this leaves you with a team of .5 people to double revenue, you’re going to need to reduce spend on other things.
And then, you are going to need to adjust your revenue target in your forecast. Or, sacrifice efficiency.
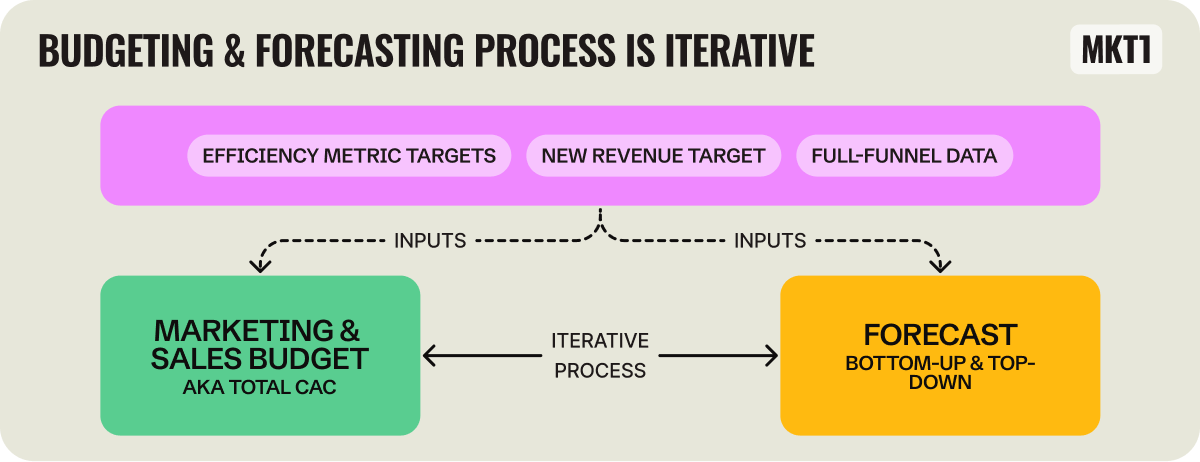
Budget and forecasting might seem like a chicken and egg situation: which do you do first? The answer: It doesn’t really matter, you do them together and it’s a highly iterative process.
Efficiency metrics overview
Efficiency metrics tell you if your go-to-market investments are driving sustainable growth–both short and long-term. You’ve probably heard these terms before, but maybe thought the calculations were a bit complex or you just let finance figure this out for you. Part of the confusion results from slightly different formulas or definitions for each, so make sure you have a standard definition within your company.
There are 3 main metrics efficiency metrics: CAC Ratio, Payback Period, and LTV:CAC ratio.
In order to understand these efficiency metrics, it’s helpful to understand the SaaS metrics needed to calculate them: ACV, Total ARR, Churn, Gross Margin, Total CAC, and Lifetime Value
This diagram breaks down each of these formulas in detail:
Benchmarks & details for the 3 marketing efficiency metrics
It’s critical to know your marketing efficiency metrics—otherwise you may be spending way too much (or way too little).
Note: My budget template and efficiency metrics calculator template for paid subscribers does this all for you! Subscribe »
All benchmarks are for early to growth-stage, venture-backed, B2B SaaS startups. For all benchmarks, remember every startup is different. Much of it depends on how much your company is comfortable spending (and has to spend) and the aggressiveness of your revenue targets.
CAC Ratio Benchmarks: .7 to 1.2
CAC Ratio indicates your efficiency at driving revenue in a 1 year period.
⬇️ A lower CAC ratio is less efficient, it means you recoup a lower % of your customer acquisition cost in 1 year. Target a lower CAC Ratio if you’re…
Prioritizing growth over efficiency
In a competitive or nascent market
Strong in cash reserves or external funding
i.e. We’re targeting .7 CAC ratio, which means we’ll recover just 70% of our customer acquisition costs after 1 year, because we raised a new round and are trying to win market share.
⬆️ A higher CAC ratio is more efficient, it means you recoup a higher % of your customer acquisition cost in 1 year. Target a higher CAC Ratio if you’re…
Prioritizing profitability and efficient growth.
In a mature or less competitive market.
Focused on sustainably scaling with shorter payback periods.
i.e. We’re targeting .12 CAC ratio, which means we’ll recover more than we spent to acquire customers after 1 year (120% of it). We are tight on cash and really focused on efficiency.
CAC Payback Period Benchmarks: 12-18 months
Payback period informs cash flow and scaling speed.
⬇️ A lower payback period is more efficient, it means you take fewer months to recoup customer acquisition costs. Target a lower payback period if you…
Have limited runway or need faster returns on investment, i.e. Bootstrapped or capital-efficient businesses.
Are optimizing for profitability over growth, often seen in more mature or slower-growing companies. i.e. Established SaaS companies aiming for sustainable operations.
Have short customer lifetimes with short retention periods, you need a faster payback to make the economics work. i.e. high-churn industries with SMB customers.
⬆️ A higher payback period is less efficient, it means you take more months to recoup customer acquisition costs. Target a higher payback period if you…
Have high retention and high LTV:CAC Ratio, i.e. Enterprise SaaS with multi-year contracts.
Are focusing on rapid growth, especially during stages of aggressive expansion into new markets.
Have access to lots of capital, i.e. Venture-backed startups in hyper-growth mode.
Have a Land-and-Expand strategy, meaning initial customer acquisition costs are high but you expect a lot of expansion revenue later.
🚩 Rule of Thumb: If your CAC payback period is longer than your average customer lifetime, it's a red flag.
LTV:CAC Benchmark: 3:1
LTV:CAC Ratio indicates if growth is sustainable in the long-term.
⬇️ An LTV:CAC Ratio lower than 3 is less efficient, it means you earn less than $3 over a customer’s lifetime from each $1 spent on acquiring a customer. Target a lower ratio if you:
Are in a hyper-competitive or emerging market, lowering LTV:CAC can help you expand faster and gain market share, even though you’ll cause short-term inefficiencies.
Have a product with upsell/cross-sell potential. A lower initial LTV:CAC is acceptable because additional revenue will drive the ratio up over time.
Have low churn and customer lifetime value is highly predictable, it’s not as risky to have a lower LTV:CAC.
⬆️ An LTV:CAC Ratio higher than 3 is more efficient (and maybe too efficient). It means you earn more than $3 from each $1 spent on acquiring a customer. Target a higher ratio if you…
Have limited cash flow and runway
Have uncertain long-term retention: When customer retention and lifetime value are less predictable or you don’t have reliable benchmarks as an early-stage startup, aim for a higher LTV:CAC to play it safe.
Are trying to appeal to investors: High LTV:CAC ratios signal disciplined growth and scalability.
Be careful: If LTV:CAC is way over 3, you might be spending too conservatively to meet targets.
This is all a whole lot easier in my budget & efficiency metrics template..
Here’s a quick walkthrough of the companion template to this newsletter, which will help orient you when going through the calculations and processes I describe. The actual template is available for paid subscribers only in our template library or at the bottom of this newsletter.
Building your budget
Here’s the process I use to set a marketing budget:
Step 1: Calculate a ballpark marketing budget using efficiency metric targets
Step 2: Figure out hiring plan & marketing headcount budget
Step 3: Break your marketing budget into categories
Step 4: Reconcile budget targets with your bottom-up forecast, and vice versa
Step 5: Set monthly budget targets
Step 6: Build out your budget & efficiency metrics summary–and check that it all makes sense
Step 7: Track budget throughout the year, with an eye on efficiency metrics
Step 8: Include your summary in your shared annual plan
Step 1: Calculate a ballpark marketing budget
I like to start with an estimate based on efficiency metric targets. There are a few ways to do this, depending on what metrics you have in front of you and what efficiency metrics you are targeting.
Marketing spend vs. sales spend

Before we dive in, an important note: All of the efficiency metrics take into account Total CAC. To calculate a marketing budget from this, you need to break Total CAC up into marketing vs. sales spend. I recommend allotting 40-45% to marketing spend if you don’t have a target, as seen in the above diagram.
3 options for calculating marketing budget based on efficiency metrics
The 3 options: Use CAC Ratio, Payback Period, and/or LTV:CAC to determine marketing budget. The purpose of using these budget calculations is to establish a starting place for your marketing budget. Typically, each method gives you a different budget, which is helpful for setting a target range.
My template for paid subscribers includes the calculators seen in the screenshots below. Subscribe »

Option A: Use CAC Ratio to calculate budget
🤔 Why use this method: This is a quick way to create an efficient budget target without needing a lot of inputs. You just need your revenue targets and the target % of your customer acquisition cost you want to earn back in a year (aka CAC Ratio).
📥 To use this method, you need to use these metrics as inputs:
CAC ratio target. Benchmark: ~.7 to 1.2
% of spend dedicated to marketing (vs sales): Benchmark: 35-45%
New ARR target: Highly dependent on your business
➗ Formula to estimate marketing budget = (New ARR / CAC Ratio) * Marketing % of total CAC
Option B: Use Payback Period to calculate budget
🤔 Why use this method: It ties your marketing spend directly to your revenue recovery goals. Often, finance teams, founders, and your investors will have a target payback period in mind, so this is an easy way to make sure you are building your budget based on that.
📥 To use this method, you need to use these metrics as inputs:
Payback period target. Benchmark: 12-18 months
% marketing spend out of total CAC: Bechmark 35-45%
New ARR target: Highly dependent on your business
Average contract value: ARR / # of customers
➗ Formula to estimate marketing budget = (CAC per customer * target # of new customers) * Marketing % of total CAC
Note: To calculate target # of new customers, divide your new ARR target by your ACV
Option C: Use LTV:CAC to calculate budget
🤔 Why use this method: This method helps you make sure marketing spend is tied to your ability to recover costs and generate profit in the long-term–not just this year. And, 3:1 is a fairly common and well-understood benchmark by founders and investors, so it’s easy to work off this target.
📥 To use this method, you need to use these metrics as inputs:
LTV:CAC target. Benchmark: 3:1
% marketing spend out of total CAC: 35-45%
New ARR target: Highly dependent on your business
Average contract value: If you don’t know this number, you can calculate it: ARR / # of customers
Churn rate: I use revenue churn in this caclucation, but you can use customer churn if you prefer and you’re consistent.
➗ Formula to estimate marketing budget = (LTV / LTV:CAC ratio) * Marketing % of total CAC
Note: LTV = Average contract value / annual churn
Additional ways to calculate budget
Some marketers determine budget based on targeting a percentage of new ARR and/or total ARR. I find the benchmarks for marketing budget as a % of revenue inconsistent compared to the 3 efficiency metrics above. But, these methods are certainly easy and if you have a target percentage in mind. A common benchmark is to allocate 30–50% of new + expansion revenue to marketing (source).
Step 2: Figure out your marketing headcount budget
You now have budget target or range for total marketing spend. To break this down into categories of spend, I always start with headcount. Why? This will be your biggest line item and you won’t be able to spend the rest of the budget efficiently if you don’t have the right people in place.

How to do this:
Get the average cost per marketing employee per year (this is more than the salary, it’s the all-in cost and you should ask HR, finance, or your founders for this)
Turn that into a monthly cost per marketer (just divide by 12!)
Calculate how many people you plan to have on your team each month–including existing team members
As an example, you have 2 existing people on the team and the average cost per employee is $150K annually or $12.5K per month.
That’s $300K per year for the 2 existing employees.
Assume you plan to hire someone in early April, add $12.5K to April headcount budget, and every month thereafter — that’s $112.5K for that employee for the year.
Assume you also plan to hire someone in November, add $12.5K in November, and $12.5K in December. That’s 25K total for that marketer next year.
The total for the year is now: $300K + $112.5K + $12.5K, for a grand total of: $425K
If you’d just calculated the yearly cost of 4 employees, you’d end up with a calculation of $600K instead of $443.75K—it’s really important you break down headcount spend by month.
Subtract this planned headcount spend from your total marketing budget target, and see what you have left. This is your remaining marketing spend.
You’ll likely need to adjust headcount later to make your total budget work, but this is a good starting place.
More from MKT1
📖 Keep reading: Paid subscribers get access to the rest of this newsletter which shares steps 4-7: breaking your budget into categories, reconciling your budget with your forecast, setting your monthly targets and summary, and tracking budget throughout the year.
✂️ Templates and discounts for paid subscribers: Paid subscribers can access our overall template library here, including the budget template previewed here. Active discounts on products we recommend.
👁️ Related newsletters: How to measure what marketing activities are driving revenue, How to build a growth (marketing) strategy, How to run effective campaigns
🧑🚀 Job board: Jobs from the MKT1 community. Paid subscribers can add jobs to our job board for free.